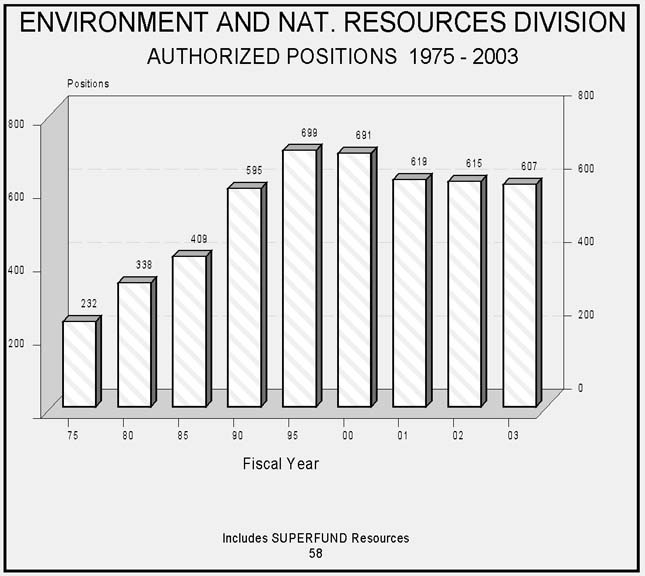
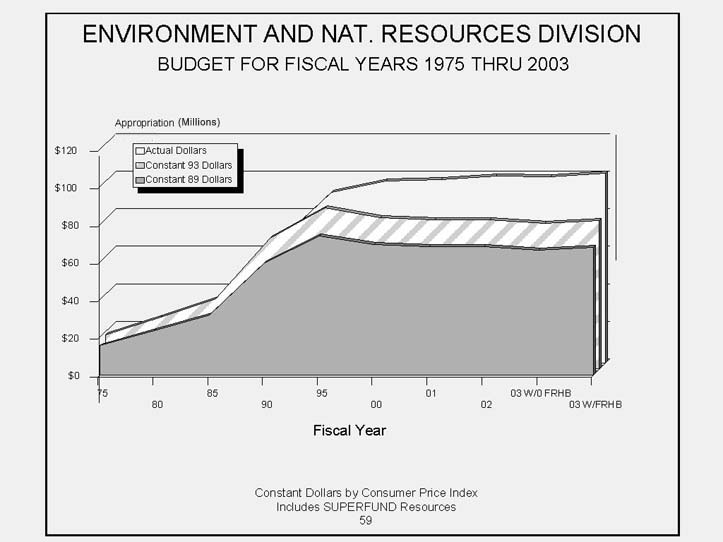
| ENVIRONMENT AND NATURAL
RESOURCES DIVISION* 1975 - 2003 |
|||||||||||||||
| FISCAL YEAR | POSITIONS | ENR BUDGET (Millions) |
CPI INDEXED TO 1993 |
ENR BUDGET IN 1993 $ (Millions) |
ENR BUDGET REAL PERCENT GROWTH FROM 1993 |
ENR BUDGET APPARENT PERCENT GROWTH FROM 1993 |
|||||||||
|---|---|---|---|---|---|---|---|---|---|---|---|---|---|---|---|
| 1975 | 232 | 6.8 | 37.4 | 18.2 | -78.9 | -92.1 | |||||||||
| 1976 | 237 | 7.1 | 39.6 | 17.9 | -79.1 | -91.7 | |||||||||
| 1977 | 245 | 7.8 | 42.1 | 18.5 | -78.5 | -90.9 | |||||||||
| 1978 | 248 | 8.8 | 45.3 | 19.4 | -77.4 | -89.8 | |||||||||
| 1979 | 263 | 10.3 | 50.4 | 20.4 | -76.3 | -88.0 | |||||||||
| 1980 | 338 | 15.8 | 57.3 | 27.6 | -67.9 | -81.6 | |||||||||
| 1981 | * | 338 | 17.4 | 63.2 | 27.6 | -67.9 | -79.7 | ||||||||
| 1982 | * | 382 | 17.1 | 67.1 | 25.6 | -70.3 | -80.1 | ||||||||
| 1983 | * | 365 | 21.1 | 69.2 | 30.5 | -64.6 | -75.5 | ||||||||
| 1984 | * | 371 | 22.7 | 72.2 | 31.5 | -63.4 | -73.6 | ||||||||
| 1985 | * | 409 | 27.8 | 74.8 | 37.2 | -56.7 | -67.6 | ||||||||
| 1986 | * | 434 | 29.1 | 76.2 | 38.2 | -55.6 | -66.2 | ||||||||
| 1987 | * | 477 | 35.5 | 79.0 | 44.9 | -47.8 | -58.8 | ||||||||
| 1988 | * | 519 | 45.1 | 82.1 | 54.9 | -36.2 | -47.6 | ||||||||
| 1989 | * | 561 | 48.6 | 85.9 | 56.6 | -34.2 | -43.5 | ||||||||
| 1990 | * | 595 | 63.5 | 91.2 | 69.7 | -19.0 | -26.1 | ||||||||
| 1991 | * | 641 | 76.0 | 94.5 | 80.4 | -6.5 | -11.6 | ||||||||
| 1992 | * | 660 | 84.7 | 97.4 | 87.0 | 1.1 | -1.5 | ||||||||
| 1993 | * | 653 | 86.0 | 100.0 | 86.0 | 0.0 | 0.0 | ||||||||
| 1994 | * | 643 | 87.3 | 103.0 | 84.7 | -1.5 | 1.5 | ||||||||
| 1995 | * | 699 | 90.7 | 105.6 | 85.9 | -0.1 | 5.4 | ||||||||
| 1996 | * | 691 | 90.1 | 108.7 | 82.8 | -3.7 | 4.8 | ||||||||
| 1997 | * | 691 | 88.0 | 111.1 | 79.2 | -7.9 | 2.4 | ||||||||
| 1998 | * # | 691 | 91.1 | 112.8 | 80.8 | -6.0 | 6.0 | ||||||||
| 1999 | * Y | 691 | 93.1 | 115.7 | 80.4 | -6.4 | 8.3 | ||||||||
| 2000 | * | 691 | 96.7 | 119.8 | 80.7 | -6.1 | 12.5 | ||||||||
| 2001 | * R | 619 | 97.7 | 122.9 | 79.5 | -7.5 | 13.6 | ||||||||
| 2002 | * | 615 | 99.5 | 125.1 | 79.5 | -7.5 | 15.7 | ||||||||
| 2003 W/O FRHB | 607 | 98.95 | 127.9 | 77.4 | -10.0 | 15.1 | |||||||||
| 2003 W/ FRHB | 607 | 101.0 | 127.9 | 79.0 | -8.2 | 17.5 | |||||||||
*Includes SUPERFUND resources as follows: |
|||||||||||||||
| 1981 | = | 140,000 | 1982= | 46,000 | 1983= | 1,987,000 | |||||||||
| 1984 | = | 2,914,000 | 1985= | 5,547,000 | 1986= | 7,683,000 | |||||||||
| 1987 | = | 11,550,000 | 1988= | 18,473,000 | 1989= | 22,100,000 | |||||||||
| 1990 | = | 28,754,000 | 1991= | 32,324,000 | 1992= | 35,489,000 | |||||||||
| 1993 | = | 34,534,000 | 1994= | 33,900,000 | 1995= | 33,900,000 | |||||||||
| 1996 | = | 32,047,000 | 1997= | 30,000,000 | 1998= | 29,963,500 | |||||||||
| 1999 | = | 30,500,000 | 2000= | 31,530,000 | 2001= | 29,164,687 | |||||||||
| 2002 | = | 28,150,000 | 2003= | 28,150,000 | |||||||||||
| ENVIRONMENT AND NATURAL
RESOURCES DIVISION* 1975 - 2003 |
|||||||||||||||
| FISCAL YEAR | POSITIONS | ENR BUDGET (Millions) |
CPI INDEXED TO 1989 |
ENR BUDGET IN 1989 $ (Millions) |
ENR BUDGET REAL PERCENT GROWTH FROM 1989 |
ENR BUDGET APPARENT PERCENT GROWTH FROM 1989 |
|||||||||
|---|---|---|---|---|---|---|---|---|---|---|---|---|---|---|---|
| 1975 | 232 | $6.8 | 43.5 | $15.6 | -67.9 | -86.0 | |||||||||
| 1976 | 237 | 7.1 | 46.0 | 15.4 | -68.3 | -85.4 | |||||||||
| 1977 | 245 | 7.8 | 49.0 | 15.9 | -67.3 | -84.0 | |||||||||
| 1978 | 248 | 8.8 | 52.8 | 16.7 | -65.7 | -81.9 | |||||||||
| 1979 | 263 | 10.3 | 58.7 | 17.5 | -63.9 | -78.8 | |||||||||
| 1980 | 338 | 15.8 | 66.6 | 23.7 | -51.2 | -67.5 | |||||||||
| 1981 | * | 338 | 17.4 | 73.6 | 23.7 | -51.2 | -64.1 | ||||||||
| 1982 | * | 382 | 17.1 | 78.1 | 22.0 | -54.8 | -64.7 | ||||||||
| 1983 | * | 365 | 21.1 | 80.6 | 26.2 | -46.2 | -56.6 | ||||||||
| 1984 | * | 371 | 22.7 | 84.0 | 27.0 | -44.4 | -53.3 | ||||||||
| 1985 | * | 409 | 27.8 | 87.0 | 32.0 | -34.1 | -42.7 | ||||||||
| 1986 | * | 434 | 29.1 | 88.7 | 32.8 | -32.5 | -40.2 | ||||||||
| 1987 | * | 477 | 35.5 | 91.9 | 38.6 | -20.7 | -27.1 | ||||||||
| 1988 | * | 519 | 45.1 | 95.6 | 47.1 | -3.0 | -7.3 | ||||||||
| 1989 | * | 561 | 48.6 | 100.0 | 48.6 | 0.0 | 0.0 | ||||||||
| 1990 | * | 595 | 63.5 | 106.1 | 59.8 | 23.1 | 30.7 | ||||||||
| 1991 | * | 641 | 76.0 | 110.0 | 69.1 | 42.1 | 56.4 | ||||||||
| 1992 | * | 660 | 84.7 | 113.3 | 74.7 | 53.7 | 74.2 | ||||||||
| 1993 | * | 653 | 86.0 | 116.4 | 73.9 | 52.0 | 76.9 | ||||||||
| 1994 | * | 643 | 87.3 | 119.9 | 72.8 | 49.8 | 79.6 | ||||||||
| 1995 | * | 699 | 90.7 | 122.9 | 73.8 | 51.8 | 86.5 | ||||||||
| 1996 | * | 691 | 90.1 | 126.6 | 71.2 | 46.4 | 85.3 | ||||||||
| 1997 | * | 691 | 88.0 | 129.3 | 68.1 | 40.1 | 81.2 | ||||||||
| 1998 | * # | 691 | 91.1 | 131.3 | 69.4 | 42.8 | 87.5 | ||||||||
| 1999 | * Y | 691 | 93.1 | 134.7 | 69.1 | 42.2 | 91.6 | ||||||||
| 2000 | * | 691 | 96.7 | 139.4 | 69.4 | 42.7 | 99.0 | ||||||||
| 2001 | * R | 619 | 97.7 | 143.0 | 68.3 | 40.5 | 101.0 | ||||||||
| 2002 | * | 615 | 99.5 | 145.6 | 68.3 | 40.6 | 104.7 | ||||||||
| 2003 W/O FRHB | 607 | 98.95 | 148.8 | 66.5 | 36.8 | 103.6 | |||||||||
| 2003 W/ FRHB | 607 | 101 | 148.8 | 67.9 | 39.7 | 107.8 | |||||||||
*Includes SUPERFUND resources as follows: |
|||||||||||||||
| 1981 | = | 140,000 | 1982= | 46,000 | 1983= | 1,987,000 | |||||||||
| 1984 | = | 2,914,000 | 1985= | 5,547,000 | 1986= | 7,683,000 | |||||||||
| 1987 | = | 11,550,000 | 1988= | 18,473,000 | 1989= | 22,100,000 | |||||||||
| 1990 | = | 28,754,000 | 1991= | 32,324,000 | 1992= | 35,489,000 | |||||||||
| 1993 | = | 34,534,000 | 1994= | 33,900,000 | 1995= | 33,900,000 | |||||||||
| 1996 | = | 32,047,000 | 1997= | 30,000,000 | 1998= | 29,963,500 | |||||||||
| 1999 | = | 30,500,000 | 2000= | 31,530,000 | 2001= | 29,164,687 | |||||||||
| 2002 | = | 28,150,000 | 2003= | 28,150,000 | |||||||||||