| CIVIL DIVISION BUDGET 1975 - 2003 |
|||||||||||||
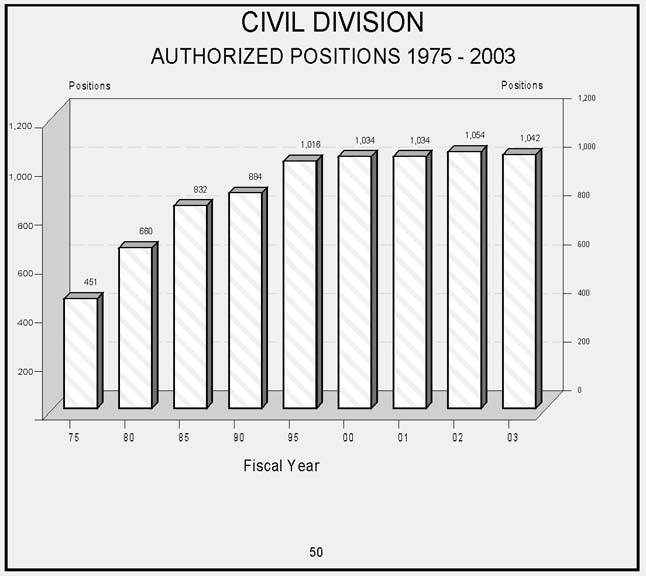
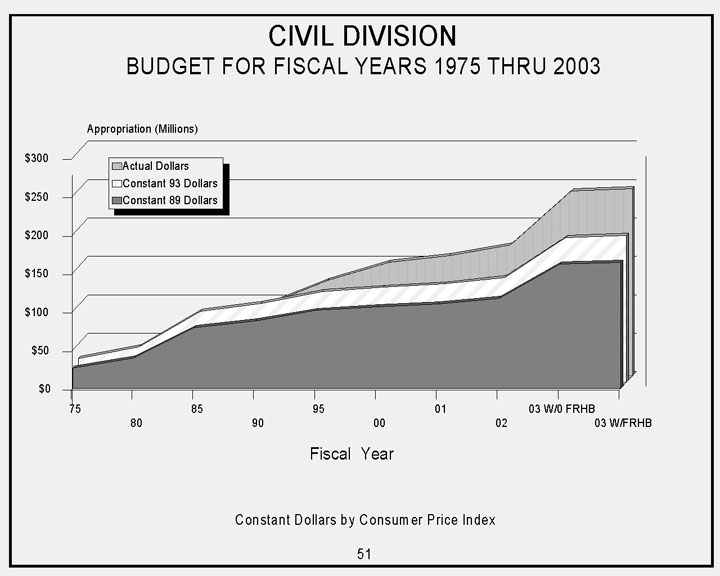
| FISCAL YEAR | POSITIONS | CIV BUDGET (Millions) |
CPI INDEXED TO 1993 |
CIVIL BUDGET IN 1993 $ (Millions) |
CIVIL BUDGET REAL PERCENT GROWTH FROM 1993 |
CIVIL BUDGET APPARENT PERCENT GROWTH FROM 1993 |
|||||||
|---|---|---|---|---|---|---|---|---|---|---|---|---|---|
| 1975 | 451 | 11.5 | 37.4 | 30.7 | -73.1 | -89.9 | |||||||
| 1976 | 480 | 12.6 | 39.6 | 31.8 | -72.2 | -89.0 | |||||||
| 1977 | 526 | 17.1 | 42.1 | 40.6 | -64.5 | -85.0 | |||||||
| 1978 | 557 | 18.7 | 45.3 | 41.2 | -63.9 | -83.7 | |||||||
| 1979 | 631 | 21.9 | 50.4 | 43.4 | -62.0 | -80.9 | |||||||
| 1980 | 660 | 26.3 | 57.3 | 45.9 | -59.8 | -77.0 | |||||||
| 1981 | 660 | 28.4 | 63.2 | 44.9 | -60.7 | -75.2 | |||||||
| 1982 | 640 | 32.0 | 67.1 | 47.7 | -58.3 | -72.0 | |||||||
| 1983 | 687 | 39.0 | 69.2 | 56.3 | -50.8 | -65.9 | |||||||
| 1984 | 785 | 57.7 | 72.2 | 79.9 | -30.1 | -49.6 | |||||||
| 1985 | 832 | 68.8 | 74.8 | 92.0 | -19.5 | -39.9 | |||||||
| 1986 | 832 | 68.0 | 76.2 | 89.2 | -22.0 | -40.5 | |||||||
| 1987 | 881 | 75.9 | 79.0 | 96.1 | -16.0 | -33.6 | |||||||
| 1988 | 881 | 85.4 | 82.1 | 104.0 | -9.1 | -25.3 | |||||||
| 1989 | 881 | 84.3 | 85.9 | 98.1 | -14.2 | -26.3 | |||||||
| 1990 | 884 | 93.0 | 91.2 | 102.0 | -10.8 | -18.7 | |||||||
| 1991 | 1,008 | 107.5 | 94.5 | 113.7 | -0.6 | -6.0 | |||||||
| 1992 | 1,025 | 115.5 | 97.4 | 118.7 | 3.7 | 1.0 | |||||||
| 1993 | * | 984 | 114.4 | 100.0 | 114.4 | 0.0 | 0.0 | ||||||
| 1994 | 979 | 118.3 | 103.0 | 114.9 | 0.4 | 3.4 | |||||||
| 1995 | V | 1,016 | 124.2 | 105.6 | 117.6 | 2.8 | 8.6 | ||||||
| 1996 | V # | 986 | 140.1 | 108.7 | 128.8 | 12.6 | 22.5 | ||||||
| 1997 | V | 999 | 128.3 | 111.1 | 115.4 | 0.9 | 12.1 | ||||||
| 1998 | V | 1,054 | 137.3 | 112.8 | 121.7 | 6.4 | 20.0 | ||||||
| 1999 | V Y | 1,054 | 142.8 | 115.7 | 123.4 | 7.9 | 24.8 | ||||||
| 2000 | V | 1,034 | 147.6 | 119.8 | 123.2 | 7.7 | 29.1 | ||||||
| 2001 | R | 1,034 | 156.7 | 122.9 | 127.5 | 11.5 | 37.0 | ||||||
| 2002 | C | 1,054 | 170.2 | 125.1 | 136.0 | 18.9 | 48.8 | ||||||
| 2003 W/O FRHB | * | 1,042 | 240.3 | 127.9 | 187.9 | 64.3 | 110.1 | ||||||
| 2003 W/ FRHB | * | 1,042 | 243.8 | 127.9 | 190.7 | 66.7 | 113.1 | ||||||
| CIVIL DIVISION BUDGET 1975 - 2003 |
|||||||||||||
| FISCAL YEAR | POSITIONS | CIV BUDGET (Millions) |
CPI INDEXED TO 1989 |
CIVIL BUDGET IN 1989 $ (Millions) |
CIVIL BUDGET REAL PERCENT GROWTH FROM 1989 |
CIVIL BUDGET APPARENT PERCENT GROWTH FROM 1989 |
|||||||
|---|---|---|---|---|---|---|---|---|---|---|---|---|---|
| 1975 | 451 | 11.5 | 43.5 | 26.4 | -68.7 | -86.4 | |||||||
| 1976 | 480 | 12.6 | 46.0 | 27.4 | -67.5 | -85.1 | |||||||
| 1977 | 526 | 17.1 | 49.0 | 34.9 | -58.6 | -79.7 | |||||||
| 1978 | 557 | 18.7 | 52.8 | 35.4 | -58.0 | -77.8 | |||||||
| 1979 | 631 | 21.9 | 58.7 | 37.3 | -55.8 | -74.0 | |||||||
| 1980 | 660 | 26.3 | 66.6 | 39.5 | -53.2 | -68.8 | |||||||
| 1981 | 660 | 28.4 | 73.6 | 38.6 | -54.2 | -66.3 | |||||||
| 1982 | 640 | 32.0 | 78.1 | 41.0 | -51.4 | -62.0 | |||||||
| 1983 | 687 | 39.0 | 80.6 | 48.4 | -42.6 | -53.7 | |||||||
| 1984 | 785 | 57.7 | 84.0 | 68.7 | -18.5 | -31.6 | |||||||
| 1985 | 832 | 68.8 | 87.0 | 79.1 | -6.2 | -18.4 | |||||||
| 1986 | 832 | 68.0 | 88.7 | 76.7 | -9.0 | -19.3 | |||||||
| 1987 | 881 | 75.9 | 91.9 | 82.6 | -2.1 | -10.0 | |||||||
| 1988 | 881 | 85.4 | 95.6 | 89.3 | 6.0 | 1.3 | |||||||
| 1989 | 881 | 84.3 | 100.0 | 84.3 | 0.0 | 0.0 | |||||||
| 1990 | 884 | 93.0 | 106.1 | 87.7 | 4.0 | 10.3 | |||||||
| 1991 | 1,008 | 107.5 | 110.0 | 97.7 | 15.9 | 27.5 | |||||||
| 1992 | 1,025 | 115.5 | 113.3 | 102.0 | 20.9 | 37.1 | |||||||
| 1993 | * | 984 | 114.4 | 116.4 | 98.3 | 16.6 | 35.7 | ||||||
| 1994 | 979 | 118.3 | 119.9 | 98.7 | 17.1 | 40.4 | |||||||
| 1995 | V | 1,016 | 124.2 | 122.9 | 101.1 | 19.9 | 47.3 | ||||||
| 1996 | V # | 986 | 140.1 | 126.6 | 110.7 | 31.3 | 66.1 | ||||||
| 1997 | V | 999 | 128.3 | 129.3 | 99.2 | 17.6 | 52.2 | ||||||
| 1998 | V | 1,054 | 137.3 | 131.3 | 104.6 | 24.1 | 62.9 | ||||||
| 1999 | V Y | 1,054 | 142.8 | 134.7 | 106.0 | 25.8 | 69.4 | ||||||
| 2000 | V | 1,034 | 147.6 | 139.4 | 105.9 | 25.6 | 75.1 | ||||||
| 2001 | R | 1,034 | 156.7 | 143.0 | 109.6 | 30.0 | 85.9 | ||||||
| 2002 | C | 1,054 | 170.2 | 145.6 | 116.9 | 38.7 | 101.9 | ||||||
| 2003 W/O FRHB | * | 1,042 | 240.3 | 148.8 | 161.5 | 91.5 | 185.1 | ||||||
| 2003 W/ FRHB | * | 1,042 | 243.8 | 148.8 | 163.8 | 94.3 | 189.2 | ||||||