New Developments
and Continuing Trends
Illicit drugs--including the drug trade's vast revenues and
sophisticated smuggling and transportation infrastructure--remain a direct
threat to the United States and its interests. Further, major drug
trafficking organizations (DTOs)--headquartered in Mexico and
Colombia--and U.S. street gangs pose a grave and evolving threat to the
national security of the United States and the hemisphere.
In 2001, 21,683 people died in the United States from licit and illicit
drug abuse. In 2000, an estimated $64 billion changed hands in the United
States for illicit drugs, and the societal costs of drug abuse were
projected at $181 billion in 2002. Further, there is mounting evidence
that the global drug trade helps to finance many of the world's terrorist
organizations and their activities.
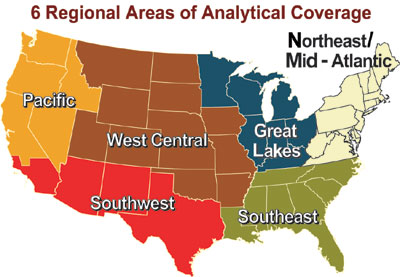
The National Drug Threat Assessment 2004 indicates that in 2002
an estimated 35.1 million persons aged 12 and older reported using an
illicit drug in the last year. Hospital emergency rooms recorded 1.2
million drug mentions. Other new and continuing trends were identified
nationally and in six geographic regions (as shown
on the 6 Regional Areas of Analytical Coverage Map).
Map 1. 6
Regional Areas of Analytical Coverage.
d-link
- Criminal organizations maintain control over drug distribution. DTOs
based in Mexico and Colombia are the primary wholesalers of most illicit
drugs in the United States, while street gangs, outlaw motorcycle gangs
(OMGs), and prison gangs are the primary retailers.
- Cocaine and methamphetamine are considered the primary drugs behind
much of the nation's drug-related violence, while marijuana remains the
most widely available and abused drug in the United States.
- Overall heroin demand appears to be trending downward, but it
continues to push into rural and suburban areas in the Northeast; heroin
seizures involving federal agencies rose again in 2002 for the fourth
year; and low cost, high purity heroin continues to attract new and
younger users.
- Pharmaceutical diversion and abuse are on the rise, with hydrocodone
and oxycodone drugs considered the greatest threats. While "doctor
shopping" and forged prescriptions are among the leading methods of
diversion, pharmaceuticals increasingly are being obtained from Mexico
and Internet pharmacies.
- Domestic methamphetamine production has increased. Further,
reporting indicates that production in Mexico, already substantial, is
increasing. Availability of ice methamphetamine is up sharply due to
production increases by Mexican groups, who may have supplanted Asian
groups as the top producers and distributors of ice nationwide.
- Vast stretches of public lands are being exploited for
methamphetamine and marijuana production. Further, law enforcement
officials report that growers are becoming more organized, well-armed,
and confrontational. Eight of the top ten national forests for cannabis
eradication are in California. California alone accounted for more than
two-thirds of cannabis plants eradicated from National Forest System (NFS)
lands.
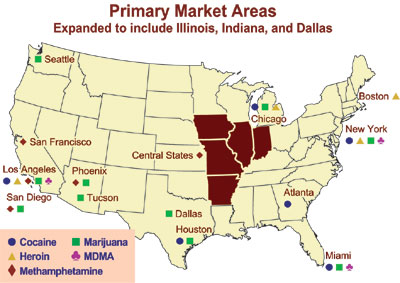
- The NDTA 2004 identifies 14 primary market areas that serve as major
centers of consumption and distribution of cocaine, methamphetamine,
marijuana, heroin, and MDMA. This year, two new markets were added to
the Central States: Indiana and Illinois for methamphetamine. Dallas was
added for marijuana. California contains three markets, the most of any
state. Los Angeles remains the only primary market for all five major
drugs of abuse.
Map 2. Primary
Market Areas: Expanded to include Illinois, Indiana, and Dallas.
d-link
- Most illicit drugs and money in the United States are transported on
highways and interstates. This Summary identifies five principal
transportation corridors, three of which emanate from the Southwest
Border. The primary corridor stretches from the Southwest Border to the
Northeast and transits eight primary markets. (See
Principal Drug Transportation Corridors Map)
- MDMA (ecstasy) use dropped significantly for eighth, tenth, and
twelfth graders during the same period that the perceived risks of using
MDMA increased among adolescents. Israeli and Russian criminal groups
are the primary wholesale distributors of MDMA in the United States.
- Synthetic drugs are poised to become an escalating threat. They can
be simple and cheap to produce and generate vast profits. Their
production is relatively unlimited due to an abundance of precursor
chemicals. New recipes are proliferating over the Internet.
To Top To Contents
Adult cocaine use stable at high levels; adolescent use trending
downward: Adult cocaine use is relatively stable at high levels,
according to Monitoring the Future (MTF) data. The rates of past year use
for powder cocaine remained unchanged from 2002 to 2003 for eighth, tenth,
and twelfth graders. Crack use among tenth graders declined significantly
from 2.3 percent in 2002 to 1.6 percent in 2003. The estimated number of
cocaine-related emergency department (ED) mentions increased from 193,034
in 2001 to 199,198 in 2002, according to the Drug Abuse Warning Network
(DAWN).
Mexican groups dominate wholesale cocaine distribution; gangs
dominate retail distribution: Mexican criminal groups control most
wholesale cocaine distribution in the Great Lakes, Pacific, Southwest, and
West Central regions and are increasing their wholesale supplies to
Dominican criminal groups in New York City. Colombian criminal groups,
however, control most wholesale cocaine distribution in the
Northeast/Mid-Atlantic and Southeast regions. At the retail level, African
American and Hispanic gangs are the predominant retail distributors of
both powder and crack cocaine in every region. Other retail distributors
of powder cocaine include Mexican criminal groups in the Great Lakes,
Southwest, Pacific, and West Central regions and Dominican, Jamaican, and
Puerto Rican criminal groups in the Northeast/Mid-Atlantic and Southeast
regions.
Table
1. Cocaine: Primary Market Areas, Market Domination and Secondary Markets.
| |
Wholesale |
Retail |
Secondary
Markets |
| Los Angeles |
Mexican, Colombian |
African American and
Hispanic gangs |
Nationwide |
| Houston |
Mexican,
Colombian, Dominican |
Mexican,
Colombian, Jamaican, Dominican criminal groups and local street gangs |
Dallas/Fort Worth, Atlanta, Chicago, New York. Crack supplied to Texas,
Louisiana, Mississippi |
| Chicago |
Mexican, Colombian |
Street gangs |
Great Lakes, areas of
NE/Mid-Atlantic, Southeast, and West Central regions |
| New York |
Colombian,
Dominican, increasingly Mexican |
African
American, Dominican, Jamaican, and Puerto Rican criminal groups, street
gangs, independent dealers |
Eastern
United States |
| Atlanta |
Mexican, Dominican |
African American and
Hispanic street gangs, local independent dealers |
NE/Mid-Atlantic and
Southeast regions |
| Miami |
Colombian |
Independent dealers control powder cocaine distribution; Haitian and
Jamaican criminal groups and African American street gangs control crack
cocaine distribution |
Eastern
United States |
To Top To Contents
Use among most age groups trending downward; consequences of use
trending upward: According to MTF, past year methamphetamine use among
young adults declined, although not significantly, from 2001 (2.8%) to
2002 (2.5%). According to DAWN, the estimated number of ED mentions for
methamphetamine increased steadily from 10,447 in 1999 to 17,696 in 2002.
Likewise, Treatment Episode Data Set (TEDS) data show that the number of
methamphetamine-related treatment admissions to publicly funded treatment
facilities increased from 58,777 in 1999 to 66,052 in 2000 (the latest
year for which such data are available).
Distribution expanding eastward, largely controlled by Mexican
wholesalers: Methamphetamine distribution is widespread in the
Pacific, Southwest, and West Central regions, is increasing in the Great
Lakes and Southeast regions, and is limited but rising in the
Northeast/Mid-Atlantic region. Mexican traffickers control most wholesale
distribution in western and southwestern states and supply methamphetamine
to Caucasian midlevel distributors in the West Central, Great Lakes, and
Southeast regions. OMGs and street gang members distribute
methamphetamine, particularly in the Great Lakes, Northeast/Mid-Atlantic,
and Southeast.
Map 3. Regional
Methamphetamine Availability: Spreading West to East.
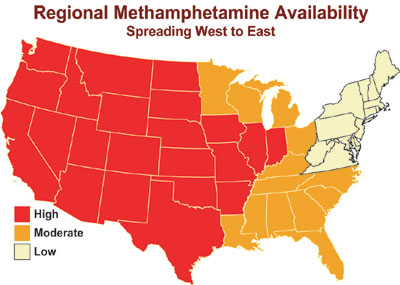
d-link
| Methamphetamine distribution increased in the Great
Lakes and Southeast regions, due largely to an expansion in the
number of Mexican distribution groups. |
Increasing lab seizures signal rise in U.S. production; possible
increase in Mexico: Domestic methamphetamine production appears to be
increasing. The number of reported methamphetamine laboratory seizures
increased overall from 2002 to 2003, while the number of reported seizures
of high capacity superlabs appears to have remained stable. The number of
reported laboratory seizures increased from 9,188 in 2002 to 9,815 in
2003. During that same period, the number of reported superlab seizures
remained almost unchanged from 2002 (145) to 2003 (143). Law enforcement
reporting indicates that methamphetamine production in Mexico--the source
of most foreign-produced methamphetamine in the United States--is
significant and may be increasing. Preliminary estimates by an
Availability Working Group indicate that the amount of domestically
produced uncut methamphetamine available in the United States in 2001
ranged from 98.3 to 131.2 metric tons; estimates for Mexico-produced uncut
methamphetamine available in the United States ranged from 9.2 to 13.9
metric tons in 2001.
| In 2003, 123 of the 143 superlabs seized
domestically were located in California. Also, in 2003, authorities
seized 3,244 laboratories in the Central States; only 4 were
superlabs. |
Production on National Forest System (NFS) lands increasing:
Methamphetamine production appears to be increasing on NFS lands. Despite
decreases in the amount of methamphetamine and the number of dumpsites
seized on NFS lands between 2001 and 2002, the number of clandestine
laboratories surged from 102 to 187. U.S. land management agencies also
warn of environmental damage to public lands and dangers to both tourists
and officials posed by booby traps and armed workers at methamphetamine
and marijuana production sites.
| Methamphetamine laboratory seizures on NFS lands
increased from 102 in 2001 to 187 in 2002, despite a drop in
seizures of methamphetamine and dumpsites. |
Mexican groups rely on Canada-sourced precursors for domestic
production: Mexican criminal groups typically produce methamphetamine
in the United States using bulk quantities of pseudoephedrine acquired
from U.S.-based Middle Eastern criminal groups that obtain the precursors
in Canada. Mexican criminal groups also produce methamphetamine in Mexico
and, to a lesser extent, in the United States, using ephedrine often
produced in China. Independent producers acquire ephedrine and
pseudoephedrine through the purchase or theft of over-the-counter
medications.1
| Ice methamphetamine availability increased sharply
last year primarily because of a significant increase in production
by Mexican criminal groups, who appear to have supplanted Asian
criminal groups as the primary producers and distributors of ice in
the United States. |
Mexican traffickers transport methamphetamine nationwide:
Mexican traffickers transport the methamphetamine that they produce in
Mexico and California to markets nationwide. OMGs and independent
producers transport methamphetamine that they produce, primarily in
California and the Central States, as well as methamphetamine supplied by
Mexican sources in California.
Table
2. Methamphetamine: Primary Market Areas, Market Domination and Secondary Markets.
| |
Wholesale |
Retail |
Secondary
Markets |
| Los Angeles |
Mexican |
Hispanic gangs,
independent dealers, OMGs, Asian gangs |
Nationwide |
|
San Francisco |
Mexican |
OMGs, street gangs, independent dealers |
Nationwide |
|
San Diego |
Mexican |
Street gangs |
Nationwide |
|
Phoenix |
Mexican |
Caucasian independent dealers, Hispanic gangs |
Eastern
United States |
|
Central States (AR, IL, IN, IA, MO) |
Mexican and
Caucasian independent dealers |
Caucasian and
Hispanic distributors supply local independent dealers at retail level |
Mostly Central
States |
To Top To Contents
Rates of past year marijuana use highest among college students aged
19-22: According to 2002 National Survey on Drug Use and Health (NSDUH)
data, more than 25 million persons aged 12 or older reported using
marijuana in the past year (11% of the U.S. population over age 12). MTF
data show that among adult marijuana users, rates of past year marijuana
use are highest among young adults aged 19 to 22. Also according to MTF
data, among adolescents, the rates of past year marijuana use in 2002 and
2003 decreased significantly from 14.6 percent to 12.8 percent for eighth
graders. Rates of use for tenth and twelfth graders trended downward, but
changes were not significant.
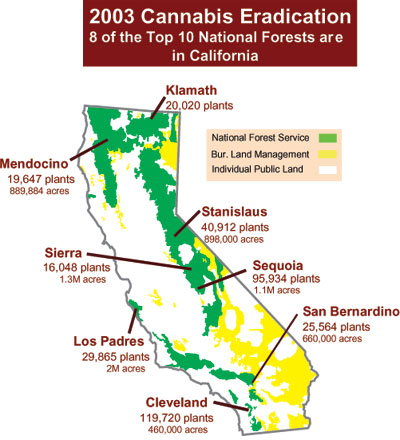
California and Mexico appear to supply most marijuana; widespread
cultivation on U.S. public lands, especially in California: While
cannabis is cultivated in every state, California, Kentucky, Tennessee,
Hawaii, and the Pacific Northwest (Washington and Oregon) are the primary
domestic source areas. Marijuana produced in Mexico, Canada, Colombia, and
Jamaica also supplies U.S. markets nationwide. Cannabis cultivation,
especially on public lands, is widespread. NFS lands in California
accounted for more than two-thirds of cannabis plants eradicated from NFS
lands in 2001 (495,536 of 719,985) and 2002 (420,866 of 597,797). Further,
8 of the 10 leading national forests for plant eradication in 2002 were in
California. Cleveland National Forest in California and Daniel Boone
National Forest in Kentucky are among the leading national forests for
eradication.
| Commercial-grade marijuana, which includes buds,
leaves, stems, and seeds from male and female plants, is the most
prevalent type available. |
Map 4. 2003
Cannabis Eradication: 8 of the Top 10 National Forests are in
California..
d-link
| In 2002, 1,099 metric tons of marijuana were
seized through investigations involving federal agencies. Of that
amount, nearly 1,016 metric tons were seized in Texas, Arizona,
California, and New Mexico. |
Mexican traffickers control transportation of wholesale marijuana:
Most foreign-produced marijuana available in the United States is
transported overland across the U.S.-Mexico border by Mexican DTOs and
criminal groups. Colombian DTOs, Asian and Jamaican criminal groups, and
Canada-based OMGs also smuggle marijuana into the United States. Within
the United States, Mexican traffickers control the transportation of the
wholesale marijuana that they produce in both Mexico and the United
States. Other marijuana transporters within the country include U.S.- and
Canada-based OMGs, Asian and Jamaican criminal groups, and local
independent growers and dealers.
Table
3. Marijuana: Primary Market Areas, Market Domination and Secondary Markets.
| |
Wholesale |
Retail |
Secondary
Markets |
Los Angeles
San Diego |
Caucasian, Mexican,
Jamaican |
Street gangs
and independent dealers |
Nationwide |
|
Seattle |
Mexican,
Caucasian independent dealers |
Caucasian, Asian, and African American independent
dealers, Mexican criminal groups, street gangs |
Alaska, Hawaii, California, Florida, Minnesota,
Washington, DC |
Phoenix
Tucson |
Mexican,
Jamaican |
Street gangs,
independent dealers |
West Central,
Southeast, and NE/Mid-Atlantic regions |
Dallas
Houston |
Mexican |
Mexican criminal groups, Hispanic and African American
gangs, prison gangs, independent dealers |
Great Lakes, NE/Mid-Atlantic, Southeast, and West Central
regions |
|
Chicago |
Mexican |
Street gangs,
independent dealers |
Great Lakes
region |
|
Miami |
Jamaican, Bahamian, Mexican |
Jamaican, Mexican, Caucasian, African American criminal
groups, street gangs, independent dealers |
Eastern United States |
|
New York |
Jamaican,
Mexican, Colombian, Caucasian, traditional organized crime groups |
Street gangs,
independent dealers |
Eastern United
States |
To Top To Contents
Heroin demand lower than for other major drugs: The overall
demand for heroin in the United States is lower than demand for other
major drugs of abuse, and rates of use appear to be trending downward for
most age groups. MTF data show that rates of heroin use among college
students (aged 19 to 22) and young adults (19 to 28) declined from 2001 to
2002, although the decline was significant only for young adults. MTF data
also show that from 2002 to 2003, rates of heroin use among adolescents
remained unchanged among eighth graders, declined significantly among
tenth graders, and declined among twelfth graders, but not significantly.
The nationwide heroin-related ED mentions remained statistically unchanged
from 2001 to 2002, according to DAWN.
| Low cost, high purity heroin continues to attract
new and young abusers because it can effectively be snorted or
smoked, eliminating the risk and stigma associated with injection.
|
Heroin expanding in suburban and rural areas of
Northeast/Mid-Atlantic: Heroin availability and distribution are
rising in many suburban and rural areas, particularly in the
Northeast/Mid-Atlantic region of the country.2
South American heroin is the primary type available in the eastern United
States, and Mexican heroin--primarily black tar and brown powder--is the
primary type available in the western United States. Colombian and Mexican
traffickers as well as Dominican, Nigerian, and Asian criminal groups are
the primary heroin wholesalers in the country. For the fourth consecutive
year, heroin seizures by federal agencies increased. Most recently, 2,521
kilograms were seized in 2001 and 2,799 kilograms in 2002.
Figure 1.
Chart Illustrating a 143 Percent Increase in Heroin Seizures
Involving Federal Law Enforcement.

Source: FDSS
d-link
Table 4. Heroin: Primary Market Areas, Market Domination and Secondary Markets.
| |
Wholesale |
Retail |
Secondary
Markets |
| Los Angeles |
Mexican |
Mexican
traffickers |
Western United
States |
|
Chicago |
Colombian, Mexican,
Nigerian |
African
American and Hispanic street gangs |
Great Lakes
and West Central regions |
|
Boston |
Colombian, Dominican |
African American, Asian, Caucasian, Colombian, Dominican,
and Puerto Rican criminal groups, street gangs, independent dealers |
New England |
|
New York |
Colombian,
Dominican, Chinese, Nigerian, Pakistani, Russian |
Dominican |
Eastern United
States |
To Top To Contents
Readily available nationwide: MDMA is available in every
region, and law enforcement reporting indicates increasing availability.
Conversely, seizure, case, and arrest information indicates stable to slightly
decreasing availability overall. The number of MDMA dosage units seized by
federal agencies decreased sharply from 4,639,540 dosage units in 2001 to
3,495,960 dosage units in 2002.
| MDMA seizures by federal agencies fell from
4,639,540 dosage units in 2001 to 3,495,960 dosage units in 2002. |
Demand for MDMA high, but trending downward, particularly
among adolescents: MDMA use among adults appears to be highest among young
adults. However, MTF data for 2002 and 2003 show that rates of past year MDMA
use decreased significantly for eighth graders (2.9% to 2.1%), tenth graders
(4.9% to 3.0%), and twelfth graders (7.4% to 4.5%). Further, MTF data also
reveal that the percentage of eighth, tenth, and twelfth grade students who
believe that individuals place themselves at great risk by using MDMA once or
twice is increasing. The estimated number of ED mentions for MDMA decreased
sharply from 5,542 in 2001 to 4,026 in 2002.
| The rates of past year MDMA use decreased
significantly for eighth, tenth, and twelfth graders between 2002
and 2003. |
Most MDMA available in the United States is produced in Europe:
Most MDMA available in the United States is produced in the Netherlands
and Belgium and transported to the United States by couriers on commercial
flights, mail services, air cargo, and maritime vessels. Very limited
quantities of MDMA produced in Asia, Canada, Mexico, and South America
also are destined for U.S. markets. Israeli and, to a lesser extent,
Russian criminal groups control MDMA transportation from Europe to the
United States although Asian, Colombian, and Dominican traffickers
increasingly are transporting MDMA from Europe as well.
Israeli and Russian traffickers control most wholesale distribution;
Caucasian males primary retail distributors: Israeli and Russian
criminal groups are the primary wholesale distributors of MDMA in the
United States. Asian, Colombian, Dominican, and Middle Eastern criminal
groups, as well as traditional organized crime, also distribute wholesale
quantities of MDMA. These groups, along with African American and Mexican
criminal groups, also control most midlevel MDMA distribution. Caucasian
males aged 18 to 30, typically independent dealers, control most retail
MDMA distribution. Other retail distributors include African American,
Asian, and Hispanic street gangs and OMGs.
Table 5. MDMA: Primary Market Areas, Market Domination and Secondary Markets.
| |
Wholesale |
Retail |
Secondary
Markets |
| Los Angeles |
Israeli,
Russian |
Independent
dealers, usually Caucasian males |
Pacific,
Southwest, West Central regions |
|
Miami |
Israeli, Russian, Colombian, Dominican |
Caucasian independent dealers |
Nationwide |
|
New York |
Israeli,
Russian, Asian, Colombian, Dominican, traditional organized crime |
Independent
dealers |
Nationwide |
To Top To Contents
Pharmaceuticals diverted by new and traditional methods: Most
pharmaceutical controlled substances abused in the United States are
diverted by forged prescriptions, "doctor shopping," and theft; however,
law enforcement agencies report that pharmaceuticals are increasingly
being obtained from Mexico and through Internet pharmacies whose sources
of supply often are in Mexico and other foreign countries.
Narcotics abuse increasing: Federal, state, and local law
enforcement agencies in every region of the country report an increase in
the availability and abuse of prescription narcotics such as hydrocodone (Vicodin),
oxycodone (OxyContin), hydromorphone (Dilaudid), and codeine. The demand,
availability, and abuse of these drugs are high and appear to be
increasing, but the abuse of hydrocodone and oxycodone drugs in particular
poses the greatest threat.
|
The diversion and abuse of pharmaceuticals, including narcotics,
depressants, and stimulants, are on the rise. The estimated number of ED
mentions for narcotic analgesics rose 20 percent from 2001 (99,317) to
2002 (119,185). |
Prescription stimulant abuse, particularly Ritalin abuse, occurring
among school students: Stimulants, particularly dextroamphetamine (Adderall)
and methylphenidate (Ritalin), are widely available in most areas. Ritalin
abuse is most noted in school settings where students with legitimate
prescriptions often share the drug with friends. Young adults also abuse
these drugs; however, overall abuse appears to be stable.
Availability and abuse of ODDs stable: The availability and
abuse of other dangerous drugs (ODDs) are moderate and relatively stable.
Particularly popular among adolescents and young adults, ODDs are most
prevalent in metropolitan areas. Some club drugs, particularly GHB and
Rohypnol, are used in drug-facilitated sexual assaults because of their
sedative properties. Although law enforcement reporting indicates
increased availability of hallucinogens within college and rave
communities, the most recent drug prevalence data indicate that overall
use of these drugs is relatively stable.
To Top To Contents
Gangs and
Organizations
Drug trafficking organizations--particularly those based in Mexico and
Colombia--are the primary wholesale distributors of most illicit drugs in
the United States.3 Colombian
DTOs control most wholesale distribution of cocaine and heroin in the
Northeast/Mid-Atlantic and Southeast regions. Mexican organizations,
however, are the dominant force in the wholesale production, supply, and
distribution of illicit drugs in the United States.
| DTOs--particularly those based in Mexico and
Colombia--are the primary wholesale distributors of most illicit
drugs in the United States. Street gangs, OMGs, and prison gangs are
the primary retail distributors of illegal drugs. |
Mexican DTOs
- dominate wholesale cocaine and methamphetamine distribution,
wholesale distribution of most foreign- and some domestic-produced
marijuana, and wholesale heroin distribution in the western United
States;
- control smuggling routes across the U.S.-Mexico border;
- are expanding their transportation of cocaine and heroin into New
York City and will continue to make inroads into and expand within
eastern U.S. drug markets;
- may be expanding their role in MDMA production and transportation.
Street gangs, OMGs, and prison gangs are the primary retail
distributors of illegal drugs in the United States. There are an estimated
850,000 active gang members in the United States. Although concentrated in
major urban areas, gangs are proliferating in rural and suburban areas.
Gangs obtain powder cocaine primarily from Colombian, Dominican, and
Mexican criminal groups and marijuana primarily from Colombian, Mexican,
and Jamaican criminal groups. Gangs obtain heroin primarily from Asian,
Colombian, Dominican, Mexican, and Nigerian groups and methamphetamine
primarily from Mexican criminal groups. Street gangs are responsible for
most of the serious violent crime in major cities.
| There are an estimated 850,000 active gang members
in the United States. |
To Top To Contents
Borders, POEs, and
Corridors
Drugs and money are transported mostly on U.S. highways within five
corridors: Illicit drugs and drug revenues are transported to primary
and secondary markets throughout the United States by passenger and
commercial vehicles, principally within five transportation corridors.
Generally, drugs flow north from the Southwest Border and the southeastern
United States, while illicit drug currency (usually in bulk) is
transported in reverse along the same highways to collection centers in
primary markets where it is readied for repatriation to foreign countries,
primarily Mexico and Colombia.4
Map 5.
Principal Drug Transportation Corridors, Drug and Currency Seizures,
2002.
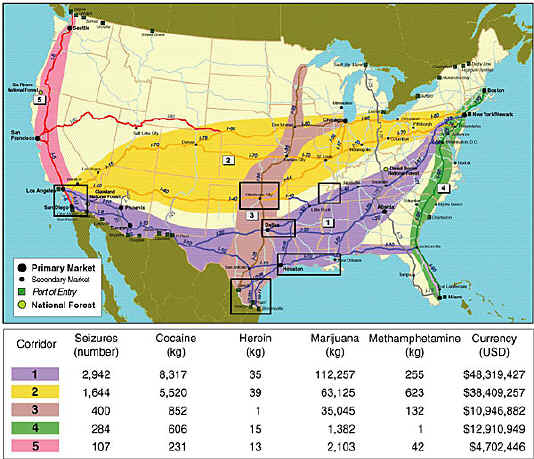
d-link
| Three of the five corridors emanate from the
Southwest Border. The primary corridor stretches from Los Angeles to
New York and transits eight primary markets. |
Map 6. Primary
Entry Points: Based on EPIC Seizure Data, 2002.
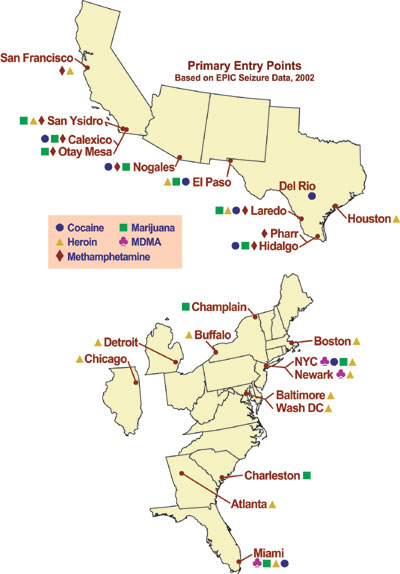
d-link
| Most drugs are smuggled through or between POEs on
the U.S.-Mexico border, through the Southeast POEs, primarily Miami,
and ports in New York and New Jersey. |
| Port of New York-New
Jersey and Port of Miami: Cocaine and marijuana are the
primary drug threats. Colombian DTOs control smuggling into these
ports. |
| Hidalgo POE:
Marijuana produced in Mexico and cocaine are the primary threats.
Smuggling is controlled by Mexican DTOs. In 2002 more than $4M was
seized in 151 outbound smuggling attempts. |
| Laredo POE:
Marijuana and cocaine are the primary threats. Mexican DTOs control
most smuggling. In 2002, $5.8M was seized in 151 outbound smuggling
attempts. |
Cocaine smuggled to and between ports of entry (POEs) on the
U.S.-Mexico border is transported along all five corridors to the Primary
Market Areas (PMAs) of Atlanta, Chicago, Houston, Los Angeles, Miami, and
New York. The primary POEs for cocaine along the Southwest Border are at
and near Hidalgo, Laredo, El Paso, Calexico, and Nogales. In 2002, 64
percent of the cocaine seized at POEs on the U.S.-Mexico border was seized
at Texas POEs.
Methamphetamine is transported from California and Mexico to the
primary markets of Los Angeles, Phoenix, San Diego, San Francisco, and the
Central States along corridors 1, 2, 3, and 5. Of the 1,223 kilograms of
methamphetamine seized on the Southwest Border in 2002, most (60%) was
seized at or between California POEs. The Detroit POE serves as a primary
POE for pseudoephedrine smuggled from Canada.
Marijuana is transported to PMAs overland in vehicles via all
five corridors to the PMAs of Chicago, Dallas/Houston, Los Angeles/San
Diego, Miami, Phoenix/Tucson, and Seattle. Marijuana is smuggled across
the U.S.-Canada border primarily at Washington and New York POEs. Once
inside the United States, BC Bud is transported along principal U.S.
interstates and highways to PMAs in Chicago, Los Angeles/San Diego, Miami,
New York, Phoenix/Tucson, and Seattle. Maritime transportation of
marijuana to the United States through the Gulf of Mexico is occurring
with greater frequency. In 2002 seizures in the Gulf of Mexico represented
approximately 24 percent of the marijuana seized at sea, up considerably
from approximately 3 percent from 1999 to 2001.
- Miami and Charleston (SC) are leading POEs for commercial maritime
seizures. Seizures in Miami dropped from 2001 (17,996 kg) to 2002 (4,178
kg).
- Almost 98 percent of drugs seized at all land POEs in 2002 were
seized at POEs on the U.S.-Mexico border.
Heroin produced in South America is smuggled by Colombian
trafficking groups using couriers traveling aboard commercial flights
destined for international airports, generally in New York or Miami.
Colombian and Dominican traffickers transport the drug throughout the
eastern United States along corridor 4. Mexican traffickers smuggle
Mexican heroin from the border area along corridors 1, 2, 3, and 5 to
markets in the Great Lakes, Pacific, Southeast, Southwest, and West
Central regions. Mexican heroin enters the United States mostly at the
Laredo, El Paso, and San Ysidro POEs.
- South American heroin is transported from Colombia to Miami and New
York. Increasing amounts are entering the U.S. overland at and between
POEs on the U.S.-Mexico border.
- Southeast Asian heroin enters North America via containerized
maritime cargo, commercial flights, and mail services. Some heroin
transported from Canada crosses the border to the northwestern United
States or through POEs at Buffalo and Detroit.
- Southwest Asian heroin is transported by couriers on commercial
flights to New York, Detroit, Chicago, and occasionally Los Angeles.
MDMA: The primary POEs for MDMA include the John F. Kennedy,
Miami, Newark Liberty, and Los Angeles International Airports. From these
POEs, MDMA usually is transported to surrounding and major market areas
along corridors 1, 2, and 4. From New York, MDMA is transported on
domestic flights to Kansas City, Los Angeles, Phoenix, San Juan, Seattle,
and Tampa markets. From Miami, MDMA is transported nationwide via
commercial air, private vehicle, mail services, passenger buses, and
trains. From Los Angeles, MDMA is transported on commercial flights to
Columbus, Denver, Fort Lauderdale, Las Vegas, Salt Lake City, and St.
Louis markets.
To Top To Contents
Outlook,
Indicators, and Warnings
- The number of low capacity methamphetamine laboratories will likely
increase in the Great Lakes and Southeast regions, as well as in several
states in the Northeast/Mid-Atlantic region, particularly Pennsylvania
and West Virginia.
- Overall marijuana availability is stable, and abuse indicators
suggest that high levels of demand for the drug will continue. Demand
for high potency marijuana will likely fuel increased indoor
cultivation.
- Gangs will be responsible for increasing drug production,
transportation, and distribution, as well as increasing drug-related
violence. One of the nation's most violent and fastest-growing gangs,
Mara Salvatrucha (MS 13), may be increasing its coordination with MS 13
chapters in Los Angeles, Washington, D.C./Northern Virginia, and New
York City, possibly signaling an attempt to build a national command
structure.
- Asian criminal groups and gangs increasingly are distributing MDMA
at wholesale and retail levels in U.S. drug markets.
- Texas POEs surpassed California POEs in the number of marijuana
seizures in 2002, reflecting a possible shift in either transportation
routes or methods used by traffickers.
- While the estimated worldwide production of heroin increased in 2002
due to a resurgence of cultivation in Afghanistan, the impact on U.S.
markets will likely be limited as heroin from Afghanistan is consumed in
Asian and European markets.
- South American heroin will remain predominant in the eastern United
States, and Mexican heroin will remain so in the western United States.
Traffickers' attempts to penetrate competing markets may be limited as
users appear to prefer the heroin common to their regions. Traffickers,
therefore, may target new and younger populations in nontraditional
markets.
- Overall MDMA demand will likely remain stable or decline in the near
term. Tracking studies show that MDMA use by adolescents and young
adults--the primary users--peaked in 2001 and has since declined.
Attitudes among adolescents indicate that their perception of risk in
using MDMA is increasing, a potential reversal of a previously
widespread perception that MDMA is a relatively safe drug.
To Top To Contents
End Notes
1 Also, see
U.S.-Canada Border Drug Threat Assessment 2003 (LOU-LES), NDIC Product
2003-R0458-002, July 2003.
2 For fuller
analysis, see Heroin in the Northeast, NDIC publication 2003-L0390H-001,
August 2003.
3 In addition to
the NDTA 2004, this section is supplemented with information drawn from other
NDIC publications. See Mexican Drug Trafficking Organizations: A National
Threat Assessment, NDIC product 2003-J0403-001, March 2003. Also see
Gangs and Drugs in the United States, NDIC product 2003-M0465-003, July
2003.
4 In addition to
the NDTA 2004, this section is supplemented with information drawn from other
NDIC reports. See Primary Drug Transportation Corridors, NDIC product
2003-J0403-003; Port of Entry Profiles for Laredo, Hidalgo, New York-New Jersey,
and Miami (2003), and Domestic Drug Flows, NDIC product 2004-20317-007,
March 2004.
|