 |
National
Drug Intelligence Center
National Drug Threat Assessment 2005
Summary Report
February 2005
National Drug Threat Assessment 2005
Summary Report
The abuse of illicit drugs such as cocaine, methamphetamine,
marijuana, heroin, and MDMA as well as diverted pharmaceuticals inflicts tremendous damage on
society, particularly on the millions of families that have a member struggling with illicit drug dependence or
addiction. According to Department of Health and Human Services data, nearly 35 million persons aged
12 or older used an illicit drug within the past year, and approximately 6.8 million were dependent on or
abusers of illicit drugs in 2003, the latest year for which such data are available. Data also
show that the
number of drug treatment admissions to publicly funded treatment facilities in 2002 reached their
highest recorded level at nearly 1.1 million.
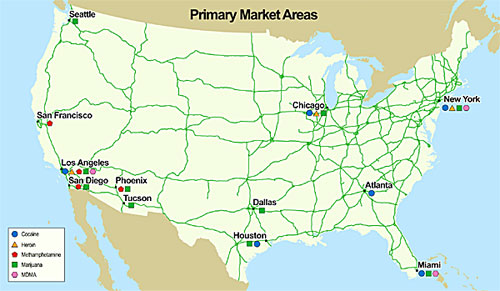
Figure 1. Primary
Market Areas
d-link
Primary Market Areas (PMAs) for cocaine, methamphetamine,
heroin, and MDMA are those cities or regions that are leading consumption areas for these drugs
based on analysis of public health data. PMAs also are among the leading national-level distribution
centers for wholesale quantities of these drugs based primarily on law enforcement reporting and analysis
of drug seizure data. PMAs for marijuana are based on national-level distribution alone because rates of
marijuana use are relatively high and stable in markets throughout the country. Although a
specific methamphetamine PMA is not identified in central or southeastern states, methamphetamine trafficking
and abuse are a very significant and increasing threat throughout those regions. (See summaries of
PMAs identified in each drug section contained herein.)
The Southwest Border area is the principal arrival zone for most
illicit drugs smuggled into the United States as well as the predominant transit
zone for the
drugs' subsequent distribution throughout the country. According to El Paso Intelligence Center (EPIC)
drug seizure data, most of the cocaine and much of the heroin, marijuana, and methamphetamine available in
domestic drug markets are smuggled into the country via the Southwest Border. As expected, 2003
EPIC data show that the amount of these drugs seized at or between land ports of entry (POEs) along
the
Southwest Border continued to be much greater than the amount seized at or between POEs along the
Northern Border. Moreover, these data show that cocaine, heroin, marijuana, and methamphetamine
shipments originating in states along the Southwest Border (Arizona, California,
New Mexico, and Texas)
were seized on domestic highways, roadways, and at airports in far greater amounts than shipments
originating in any other region of the country.
Table 1. Drug Seizures at Ports of Entry in Kilograms,
Southwest
Border vs. Northern Border, 2003
| |
Southwest Border |
Northern Border |
| Cocaine |
15,927 |
154 |
| Heroin |
291.5 |
0 |
| Marijuana |
1,173,128 |
11,183 |
| Methamphetamine |
1,733 |
0.2 |
Source: El Paso Intelligence Center.
Table 2. Seizures of Drugs in Kilograms
Originating
in Southwest Border States vs. All Other States,
2003
| |
Southwest Border
States |
All Other States |
| Cocaine |
4,391 |
1,564 |
| Heroin |
82 |
96 |
| Marijuana |
91,270 |
6,066 |
| Methamphetamine |
1,080 |
101 |
Source: El Paso Intelligence Center.
To Top
To Contents
Key Findings
Trends and Developments
Availability
Demand
Production
Transportation
Distribution
The threat posed to the United States by the trafficking and
abuse of cocaine is very high. Despite significant success by the counterdrug community in reducing
worldwide cocaine production and increasing cocaine seizures, cocaine remains readily available
throughout the country. Moreover, past year rates of use for cocaine, although declining among most age
groups, remain relatively high. In fact, National Survey on Drug Use and Health
(NSDUH) data indicate
that in 2003 more than 5.9 million persons aged 12 or older had used cocaine within the past year.
-
Key indicators of domestic cocaine availability show stable
or slightly increased availability in drug markets throughout the country despite
interagency
estimates that indicate sharp decreases in the amount of cocaine transported toward the United
States from South America in 2003. There is, however, little interagency consensus as to
the reasons for this disparity. Nevertheless, uncertainty in data such as coca cultivation,
cocaine production, and domestic cocaine supply and consumption estimates likely accounts for
much of the disparity. Another explanation for the disparity is a possible reduction in cocaine
supplies to other world markets in order to sustain supplies in the United States; however,
there are no conclusive data or reporting to support this assertion.
-
Use of powder cocaine and crack has decreased among eighth,
tenth, and twelfth graders since 1999. Powder cocaine use among adults has increased since 1999,
while crack use has trended downward slightly.
-
According to intelligence community estimates, potential
worldwide cocaine production has decreased sharply since 2001, primarily because of a 34 percent
decline in cocaine production in Colombia from 700 metric tons in 2001 to 460 metric tons in
2003.
Table 3. Andean Region Coca Cultivation in Hectares,
and
Potential Cocaine Production, in Metric Tons, (100% pure), 1999-2003
| |
1999 |
2000 |
2001 |
2002 |
2003 |
| Net Cultivation (ha) |
183,000 |
190,000 |
223,700 |
205,450 |
173,450 |
| Potential Cocaine Production (mt) |
730 |
750 |
900 |
800 |
655 |
Source: Crime and Narcotics Center: Major
Narcotics-Producing
Nations.
- The estimated total amount of cocaine destined for U.S. drug
markets decreased sharply in 2003.
Table 4. Cocaine Losses in Transit Toward the United States, in
Metric Tons,
2002-2003
| |
Departed South America
Moving Toward U.S. |
Lost or Seized in
Transit Toward U.S. |
Seized in
U.S. Arrival Zone |
Cocaine Available
to U.S. Markets |
| 2002 |
532 |
138 |
32 |
362 |
| 2003 |
422 |
157 |
32 |
233 |
Source: Interagency Assessment of Cocaine Movement 2003.
-
According to the Interagency Assessment of Cocaine Movement
(IACM), an estimated 77 percent of the cocaine detected moving toward the United States in 2003
was transported through the Mexico-Central America corridor, an increase from 72 percent
in 2002. Moreover, preliminary data show that the percentage of cocaine detected moving toward
the United States through the Mexico-Central America corridor may have been higher
than 90 percent in 2004.
Figure 2.
Cocaine Flows to the United States

Source: Interagency Assessment of Cocaine Movement, 2003.
Boundary representations are not necessarily authoritative.
-
Cocaine seizures in Texas have increased sharply since 2001
relative to other states along the Southwest Border. Texas now appears to be the
state through
which most cocaine is smuggled into the country.
-
Houston has emerged as a leading cocaine distribution center
in the United States. From 2002 through 2003 more cocaine was seized originating in Houston than
in any other city.
To Top
To Contents
Availability
Despite apparent decreases in the amount of cocaine transported
toward the United States from South America in 2003, key indicators of domestic cocaine
availability show stable or slightly increased cocaine availability in drug markets throughout the
country. According to the IACM, the estimated amount of cocaine successfully transported to the U.S. Arrival
Zone decreased approximately 46 percent from 494 metric tons in 2002 to 265 metric tons in 2003.
Nevertheless, Drug Enforcement Administration (DEA) and High Intensity Drug Trafficking Area (HIDTA)
reporting indicates that cocaine remains readily available throughout the country and
that availability increased slightly in some areas in 2003. No DEA Field Division or HIDTA office reported
decreasing cocaine availability. State and local law enforcement agencies also indicated, via the NDIC
National Drug Threat Survey (NDTS) 2004, slightly increased cocaine availability overall in 2003.
Moreover, DEA drug price data for 2003 indicate that wholesale cocaine prices have neither increased
nor decreased beyond 2002 price ranges, and DEA cocaine purity data show that average wholesale cocaine
purity in metropolitan areas increased 11.4 percent (70% pure to 78% pure) from 2001 through
2003.
NDIC Comment: There is little interagency consensus
as to the reasons for the disparity in reporting with respect to apparent stable domestic cocaine availability
despite reported decreases in cocaine production and transportation toward the United States.
Nevertheless, uncertainty in data such as coca cultivation, cocaine production, and domestic cocaine supply and
consumption estimates likely accounts for much of the disparity. Another explanation for the
disparity is a possible reduction in cocaine supplies to other world markets in order to sustain
supplies in the United States; however, there are no conclusive data or reporting to support this assertion.
Demand
Rates of past year use for powder cocaine and crack have
decreased among all adolescent age groups since 1999. According to the Monitoring the Future (MTF)
study, rates of past year use for powder cocaine have trended downward from 1999 to 2004 among eighth
(2.3% to 1.6%), tenth (4.4% to 3.3%), and twelfth graders (5.8% to 4.7%). Similarly, rates of
past year use for crack have trended downward from 1999 to 2003 among eighth (1.8% to 1.3%), tenth
(2.4% to 1.7%), and twelfth graders (2.7% to 2.3%).
NDIC Comment: Declines in past year use of powder
cocaine and crack among adolescents appear to be primarily the result of decreased rates of use
among adolescent males. According to MTF, from 1999 to 2002 rates of past year cocaine (both powder and
crack) use declined more sharply among eighth- (2.8% to 2.2%), tenth- (5.2% to 4.2%), and
twelfth-grade males (7.3% to 5.9%) than among eighth- (2.7% to 2.3%), tenth- (4.6% to 3.9%), and
twelfth-grade females (5.0% to 4.0%).
Production
Worldwide cocaine production has decreased sharply since 2001,
primarily because of decreased cocaine production in Colombia. According to interagency
estimates, potential cocaine production in the Andean region of South America (Colombia, Bolivia, and Peru)
accounts for virtually all worldwide cocaine production. Potential cocaine production (100% pure) in
the Andean region decreased 27 percent from 900 metric tons in 2001 to 655 metric tons in 2003,
primarily driven by a 34 percent decrease in potential cocaine production in Colombia from 700 metric tons
in 2001 to 460 metric tons in 2003.
NDIC Comment: Sharp decreases in potential cocaine
production in Colombia are due primarily to significant increases in aerial eradication of coca in that
country as well as improved timing of coca field spraying to increase overall effectiveness. According to
U.S. embassy reporting, aerial coca eradication in Colombia increased approximately 44 percent from
approximately 90,000 hectares in 2001 to 130,000 hectares in 2003. Moreover, expanded coca aerial
eradication in Colombia has forced many coca farmers to harvest leaves early, resulting in lower coca
leaf yields per coca field in areas of sustained aerial eradication.
To Top
To Contents
Transportation
The percentage of cocaine seized along the Texas-Mexico border
relative to all Southwest Border cocaine seizures increased sharply from 2001 to 2002 and
remained stable in 2003. According to EPIC seizure data, of the cocaine seized at POEs, between POEs, or at
checkpoints along the Southwest Border, the percentage seized in Texas increased from 62.9 percent
(12,782 of 20,309 kg) in 2001 to 71.8 percent (16,244 of 22,628 kg) in 2002 and remained stable at
71.4 percent (11,365 of 15,924 kg) in 2003. Typically, cocaine smuggled over the Southwest Border is
transported by Mexican DTOs and criminal groups to PMAs.
NDIC Comment: The increased proportion of cocaine
seized in Texas relative to all cocaine seized along the Southwest Border may reflect an increase in the amount
of cocaine smuggled through Texas en route to drug markets in the eastern United States. According
to interagency estimates, the amount of cocaine transported from South America via the Caribbean for
distribution in U.S. drug markets in the eastern half of the country deceased 9 percent from 31
percent in 2001 to 22 percent in 2003. Moreover, since 2001, law enforcement agencies in New York and New Jersey
have reported a significant increase in the amount of cocaine supplied to their areas by
Mexican criminal groups transporting the drug from the Southwest Border, particularly Texas.
There is uncertainty as to the reason for the possible increase
in the percentage of cocaine transported through Texas. The shift may simply be the result of an increase
in the amount of cocaine supplying markets in eastern states that is transported through the Mexico-Central
America corridor and smuggled through Texas because of its proximity to the eastern
drug markets relative to other states along the U.S.-Mexico border. However, improved detection
capability and resources may also account for increased seizures in Texas. Another possible
explanation is that the shift is the result of disruption to a large Tijuana-based DTO resulting in an increase
in smuggling through other areas along the U.S.-Mexico border, particularly Texas. There is,
however, no consensus with respect to any of the reasons offered.
Distribution
Houston has emerged as a leading cocaine distribution center in
the United States. According to EPIC seizure data for 2002 and 2003, more cocaine coming from
Houston (1,361 kg) was seized on domestic highways, railways, and at airports than cocaine coming
from any other city, including Los Angeles (1,073 kg), Atlanta (682 kg), or Phoenix (504 kg).
Moreover, cocaine seizure data show that wholesale quantities of cocaine are distributed from Houston to
numerous significant drug markets in most regions of the country including Atlanta, Chicago, and New
York.
NDIC Comment: Houston's emergence as a leading
cocaine distribution center may reflect the increased role of Texas as a transit area for cocaine destined
for drug markets, particularly in the eastern United States. As previously stated, drug seizure data,
intelligence reporting, and interagency cocaine flow estimates strongly indicate that cocaine smuggling
through and between POEs in Texas has increased significantly relative to other Arrival Zone areas
since 2001. The emergence of Houston as a leading distribution center for cocaine is consistent with
that trend.
|
Cocaine Primary Market Areas
Atlanta, Chicago, Los Angeles, Houston, Miami, and New York are
the cocaine PMAs because these cities have demonstrated very high levels of cocaine abuse
and are among the largest regional- or national-level cocaine distribution centers. Dallas
and Phoenix are national-level cocaine distribution centers, but cocaine abuse in these cities
is significantly lower than in many metropolitan areas. Cocaine consumption is very high in
Baltimore, Detroit, and Philadelphia; however, drug seizure data show relatively little cocaine
distribution from these cities to other significant drug markets.
Atlanta. Cocaine use in Atlanta is very high and may be
increasing as evidenced by an increasing number of ED mentions for cocaine in Atlanta. Mexican and, to a
lesser extent, Colombian and Dominican criminal groups control most wholesale cocaine
distribution in Atlanta.
Chicago. The number of ED mentions for cocaine in Chicago is
very high and increasing. In fact, Chicago ranked first among Drug Abuse Warning Network (DAWN)
reporting cities for the number of ED mentions for cocaine (16,227). Mexican and, to a much
lesser extent, Colombian criminal groups control most wholesale cocaine distribution in Chicago.
Los Angeles. The number of ED mentions for cocaine in Los
Angeles is very high and has increased sharply overall since 1999. Most wholesale and
midlevel cocaine distribution in Los Angeles is controlled by Mexican criminal groups. Los Angeles is
a national-level cocaine distribution center supplying wholesale quantities of the drug to significant
drug markets in every region of the country.
Houston. Data from the Texas Commission on Alcohol and Drug
Abuse (TCADA) show that the number of treatment admissions for cocaine in Harris County is
very high and increasing. Mexican criminal groups are the primary wholesale cocaine distributors
in Houston. According to EPIC drug seizure data, Houston is a national-level cocaine
distribution center.
Miami. According to DAWN, the number of ED mentions for
cocaine in Miami is relatively high and increasing. Colombian DTOs control most wholesale cocaine
distribution in Miami. EPIC drug seizure data indicate that Miami is a significant cocaine distribution
center.
New York. Although the number of ED mentions for cocaine in
New York is decreasing, the number remains very high. Colombian DTOs and criminal groups control
most wholesale cocaine distribution in New York; however, Dominican criminal groups also distribute
significant wholesale quantities of cocaine in New York. Wholesale cocaine
distribution by Mexican criminal groups is somewhat limited but increasing.
|
To Top To Contents
To Next Page
To Publications Page
To
Home Page
|