National Drug Intelligence Center |
From January 1, 2008, through December 31, 2008, NDIC FPSs reported, and intelligence analysts studied, a number of developing issues in various drug markets throughout the United States, including the following:
Individuals and criminal groups are increasingly circumventing pseudoephedrine sales restrictions by purchasing numerous packages of pseudoephedrine products from multiple retail locations. In some areas of the country, individuals and criminal groups are facilitating methamphetamine production by evading pseudoephedrine sales restrictions through multiple small-quantity pseudoephedrine product purchases at or below threshold levels from numerous retail locations. This practice is commonly known as smurfing. (See text box.)
|
Pseudoephedrine Smurfing Smurfing is a method used by some methamphetamine traffickers to accumulate large quantities of pseudoephedrine for use as a precursor in methamphetamine production. Methamphetamine producers often enlist several friends or associates as "smurfs" to increase the speed of their smurfing operations and the quantity of chemicals acquired. The smurfs typically purchase over-the-counter cold medications containing pseudoephedrine in quantities at or below federal, state, or local legal thresholds from multiple retail locations to avoid detection. |
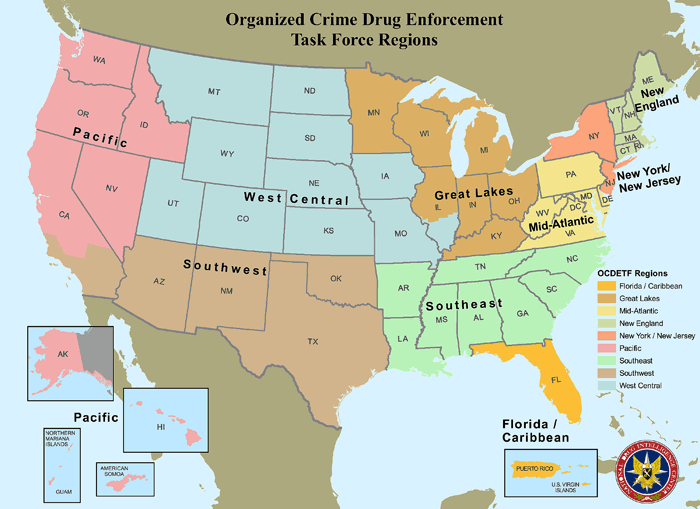
Law enforcement reporting from the Great Lakes, Pacific, Southeast, Southwest, and West Central Organized Crime Drug Enforcement Task Force (OCDETF) Regions (see Figure 1) indicates that individuals and criminal groups are increasingly organizing pseudoephedrine smurfing operations and selling the medications to methamphetamine producers or trading them for the drug. (See Table 1.)
Figure 1. Organized Crime Drug Enforcement Task Force Regions
Table 1. Cities Reporting an Increase in Pseudoephedrine Smurfing in 2008
| State | City | OCDETF Region |
|---|---|---|
| Arizona | Phoenix | Southwest |
| California | Los Angeles Oakland San Diego San Francisco San Jose Santa Cruz |
Southwest Pacific Southwest Pacific Pacific Pacific |
| Colorado | Colorado Springs Denver |
West Central |
| Georgia | Atlanta Canton |
Southeast |
| Illinois | Carbondale Springdale |
Great Lakes |
| Indiana | Indianapolis | Great Lakes |
| Kansas | Fort Scott Pittsburg |
West Central |
| Kentucky | Owensboro | Great Lakes |
| Missouri | Joplin Kansas City St. Louis |
West Central |
| Nebraska | Columbus North Platte |
West Central |
| North Carolina | Statesville | Southeast |
| Oklahoma | Tulsa | Southwest |
| South Carolina | Greenville | Southeast |
Source: Federal, state, and local law enforcement reporting.
Pseudoephedrine smurfing is particularly prevalent in California. For instance:
Pseudoephedrine smurfing quite likely has contributed to recent increases in methamphetamine production in some regions. Methamphetamine laboratory seizures increased in the Great Lakes, Southeast, Southwest, and West Central OCDETF Regions from 2007 to 2008 after decreasing every prior year since 2004, according to the National Seizure System (NSS). (See Table 2.) Also according to NSS, 51 of the 60 tablet extraction laboratories seized in 2008 were located in the Southwest and West Central Regions--regions where smurfing has increased. While smurfing was noted in California, NDIC did not receive reports of increased smurfing in the northern Pacific Region and noted decreased methamphetamine laboratory seizures in the Pacific Region. One factor that quite likely contributed to decreased seizures in the Pacific Region was the passage of state-level legislation directing the Oregon Board of Pharmacy to adopt rules classifying products containing ephedrine, pseudoephedrine, and phenylpropanolamine as Schedule III controlled substances by July 1, 2006.3 This legislation most likely had an ultimate effect of little to no smurfing activity in that state.
Table 2. Methamphetamine Laboratory Seizures, 2004-2008
| OCDETF Region | 2004 | 2005 | 2006 | 2007 | 2008 | Change 2007-2008 |
Percent Change 2007-2008 |
|---|---|---|---|---|---|---|---|
| Florida/Caribbean | 216 | 200 | 103 | 103 | 64 | -39 | -38% |
| Great Lakes | 1,680 | 1,357 | 956 | 796 | 929 | +133 | +17% |
| Mid-Atlantic | 236 | 182 | 109 | 55 | 54 | -1 | -2% |
| New England | 7 | 17 | 10 | 3 | 2 | -1 | -33% |
| New York/New Jersey | 35 | 22 | 35 | 13 | 10 | -3 | -23% |
| Pacific | 1,288 | 582 | 260 | 172 | 115 | -57 | -33% |
| Southeast | 2,854 | 1,694 | 1,346 | 954 | 1,105 | +151 | +16% |
| Southwest | 1,205 | 528 | 365 | 189 | 220 | +31 | +16% |
| West Central | 2,493 | 1,428 | 759 | 686 | 729 | +43 | +6% |
| Total | 10,014 | 6,010 | 3,943 | 2,971 | 3,228 | +257 | +9% |
Source: National Seizure System.
Street gang and OMG members are increasingly diverting and distributing pharmaceuticals. The percentage of law enforcement agencies nationwide reporting street gang involvement in the diversion and distribution of pharmaceuticals trended upward from more than 32 percent in 2004 to more than 44 percent in 2008, according to NDIC National Drug Threat Survey (NDTS) data. However, the level of street gang involvement in pharmaceutical diversion and distribution varied regionally during the same period. According to the NDTS data, the 5-year (2004 through 2008) average percentage of law enforcement agencies reporting street gang involvement in pharmaceutical diversion and distribution ranged from 30 percent in the Mid-Atlantic and New England Regions to 49 percent in the Southwest Region. (See Table 3.) The following anecdotal law enforcement reporting from officials throughout the country illustrates the NDTS findings:
Table 3. Percentage of Law Enforcement Agencies Reporting Street Gang Involvement in Pharmaceutical Distribution, by Region and Nationwide, 2004-2008
| OCDETF Region | 2004 | 2005 | 2006 | 2007* | 2008 | Amount of Increase/Decrease 2007-2008 |
Amount of Increase/Decrease 2004-2008 |
Five-Year Average 2004-2008 |
|---|---|---|---|---|---|---|---|---|
| Florida/Caribbean | 28.3% | 45.6% | 37.9% | 43.7% | 54.7% | +11.0% | +26.4% | 42.0% |
| Great Lakes | 33.6% | 34.2% | 40.0% | 36.1% | 40.5% | +4.4% | +6.9% | 36.9% |
| Mid-Atlantic | 21.7% | 25.4% | 29.0% | 39.4% | 34.8% | -4.6% | +13.1% | 30.0% |
| New England | 23.9% | 32.7% | 31.8% | 35.9% | 27.8% | -8.1% | +3.9% | 30.4% |
| New York/New Jersey | 27.5% | 40.8% | 39.8% | 46.3% | 45.7% | -6% | +18.2% | 40.0% |
| Pacific | 36.2% | 41.7% | 43.9% | 49.0% | 45.2% | -3.8% | +9.0% | 43.2% |
| Southeast | 35.8% | 40.8% | 40.3% | 47.0% | 52.4% | +5.4% | +16.6% | 43.3% |
| Southwest | 42.0% | 48.0% | 49.4% | 52.8% | 53.0% | +.2% | +11.0% | 49.0% |
| West Central | 31.5% | 35.2% | 38.7% | 38.9% | 40.7% | +1.8% | +9.2% | 37.0% |
| United States | 32.5% | 37.9% | 39.7% | 42.8% | 44.2% | +1.4% | +11.7% | 39.4% |
Source: National Drug Threat Survey.
*
In 2007, Arkansas was included in the Southeast
OCDETF Region; from 2003 through 2006 Arkansas was included in the West Central
OCDETF Region.
The percentage of law enforcement agencies nationwide reporting OMG involvement in pharmaceutical diversion and distribution also trended upward between 2004 and 2008--from approximately 22 percent to 26 percent, according to the NDTS; however, percentages fluctuated regionally. (See Table 4.) The 5-year (2004 through 2008) average percentage of law enforcement agencies reporting OMG involvement in pharmaceutical diversion and distribution ranged from 20 percent in the Southeast Region to 32 percent in the Pacific Region. The following anecdotal law enforcement reporting from officials throughout the country illustrates the NDTS findings:
Table 4. Percentage of Law Enforcement Agencies Reporting OMG Involvement in Pharmaceutical Distribution, by Region and Nationwide, 2004-2008
| OCDETF Region | 2004 | 2005 | 2006 | 2007* | 2008 | Amount of Increase/Decrease 2007-2008 |
Amount of Increase/Decrease 2004-2008 |
Five-Year Average 2004-2008 |
|---|---|---|---|---|---|---|---|---|
| Florida/Caribbean | 17.7% | 21.7% | 23.7% | 26.6% | 30.4% | +3.8% | +12.7% | 24.0% |
| Great Lakes | 25.8% | 26.1% | 25.7% | 27.5% | 28.3% | +0.8% | +2.5% | 26.7% |
| Mid-Atlantic | 16.9% | 19.7% | 26.2% | 28.6% | 24.7% | -3.9% | +7.8% | 23.2% |
| New England | 26.3% | 32.4% | 33.5% | 30.2% | 28.9% | -1.3% | +2.6% | 30.2% |
| New York/New Jersey | 19.2% | 27.1% | 23.3% | 24.0% | 23.6% | -.4% | +4.4% | 23.4% |
| Pacific | 23.3% | 31.9% | 33.6% | 40.4% | 32.4% | -8% | +9.1% | 32.3% |
| Southeast | 19.4% | 20.1% | 19.1% | 22.6% | 21.0% | -1.6% | +1.6% | 20.4% |
| Southwest | 22.8% | 26.9% | 26.5% | 31.2% | 29.3% | -1.9% | +6.5% | 27.3% |
| West Central | 23.1% | 24.3% | 22.4% | 25.9% | 20.6% | -5.3% | -2.5% | 23.2% |
| United States | 22.2% | 25.3% | 25.2% | 27.7% | 25.9% | -1.8% | +3.7% | 25.3% |
Source: National Drug Threat Survey.
*
In 2007, Arkansas was included in the Southeast
OCDETF Region; from 2003 through 2006 Arkansas was included in the West Central
OCDETF Region.
Metal thieves linked to drug abuse are becoming more brazen. According to law enforcement and open-source reporting, drug abusers and some low-level distributors are increasingly stealing metals such as aluminum, brass, bronze, copper, palladium, platinum, rhodium, and stainless steel and selling them to junk dealers, recycling businesses, and salvage yards to finance drug purchases and/or drug operations. Metals are at historically high prices, rendering the theft of recyclable metals particularly lucrative. Such activity is reflected in the following examples:
Many state governments have enacted legislation to combat the increasing problem of metal thefts, and numerous state governments are currently considering anti-metal theft legislation. According to the National Conference of State Legislatures, as of December 2008, 33 states had enacted metal theft laws, and 27 states were either considering new legislation or revisiting existing legislation. For instance, a bill before the Florida Legislature would require scrap dealers to gather and archive information on people who sell them metal products. The bill would also stiffen penalties against those who damage essential services and systems in the course of stealing metals. Proposed legislation aimed at combating metal theft was introduced in Congress during early 2009; it is drawing opposition from private interests representing scrap recycling industries. (See text box.)
|
Proposed Federal Legislation to Reduce Metal Theft On February 12, 2009, S. 418, the Secondary Metal Theft Prevention Act of 2009, was introduced in the U.S. Senate. The proposed legislation would make it more difficult for thieves to sell stolen metals to scrap metal--and other--dealers. It contains a "Do Not Buy" provision, which bans scrap metal dealers from buying specific items unless sellers establish, by written documentation, that they are authorized to sell the secondary metal in question. The bill calls for enforcement by the Federal Trade Commission and gives state attorneys general the ability to bring civil action to enforce the provisions of the legislation. The Institute of Scrap Recycling Industries (ISRI), a member of the National Crime Prevention Council, rejects the metal theft measures contained in S. 418 as proposed, claiming that the legislation should first ensure prosecution of scrap thieves, rather than administering fines on the industry. The ISRI maintains that most scrap recyclers already collect much of the information required under the proposed legislation and work closely with law enforcement personnel investigating metal thefts. |
Businesses are implementing their own measures to combat metal theft. For example, electric utilities and local government in Oregon have formed a metal theft task force in an attempt to reduce thefts. The Eugene Water & Electric Board, composed of five electric utilities in Eugene, and the Bonneville Power Administration, headquartered in Portland, designed a program in which each utility selected a different color to paint all of its otherwise unidentifiable copper grounding wires; they then printed a corresponding flyer listing each utility's name and respective color to help scrap metal recyclers and law enforcement trace the wiring. Another utility, American Electric Power Ohio, is replacing its copper wire with copper-clad wiring that has no scrap dollar value and is very difficult to cut. Also, electric utilities across the state of Georgia are offering a $500 reward for information leading to the arrest and conviction of individuals involved in the theft of copper and other metals from their properties. In August 2008, telecommunications company AT&T California began offering statewide rewards, up to $10,000, for information leading to the arrest and conviction of individuals who are cutting and stealing its telephone cable from utility poles throughout California.
Additionally, the Director of Metal Theft Prevention and National Law Enforcement Liaison of ISRI reports that stakeholders in metal theft--law enforcement, recyclers, railroad investigators, telecommunications companies, and utility companies--are taking preventative measures such as materials marking, aggressive patrol, better surveillance, stakeouts, stings, GPS usage (installed on farm machinery), and the promotion of partnerships between law enforcement and recyclers.
Burglars who target pharmacies for prescription drugs are becoming more sophisticated, using knowledge of alarm systems and police procedures to their advantage. Recent law enforcement reporting and anecdotal information indicate that pharmacy burglars are using burglary techniques involving technical knowledge of alarm systems and police responses to alarm calls to evade detection. One technique involves burglars disconnecting power supplies to disable alarm systems of targeted pharmacies prior to breaking and entering. Once an alarm system is disabled, burglars hide, waiting to make entry until the police have responded, checked the building, and departed. Although police notify the store owners or points of contact that the store alarm was activated, the owners/points of contact rarely visit the businesses--particularly in early morning hours--when advised by police that the sites are secure. Another technique employed by pharmacy burglars is to break into adjacent stores and cut holes through common walls to access the pharmacies. Pharmacy burglars also breach building security measures by cutting holes in pharmacy roofs, rather than by breaking and entering through doors or windows. These burglars lower themselves into buildings using climbing equipment to avoid tripping alarm sensors. For instance:
2.
Blister packs are the most common form of packaging
for pseudoephedrine-containing medications distributed in the United States. A blister
pack consists of a clear plastic overlay that houses each tablet, capsule, or caplet
individually. The clear plastic housing is affixed to a backing that typically is
constructed of foil or a combination of foil and paper from which the medication
must be removed before use.
3.
State of Oregon, Oregon Medical Board, Current Events,
"Schedule III listing now includes pseudoephedrine, related substances," information
retrieved from http://www.oregon.gov/OMB/CurrentEvents.shtml on April 1, 2008; 73rd
Oregon Legislative Assembly-2005 Regular Session, Measure 2485 C, Staff Measure
Summary, Senate Committee on Rules, information obtained from http://www.leg.state.or.us/comm/sms/sms05/hb2485csrules07-25-2005.pdf
on April 1, 2008.
To Top To Contents To Next Page
To Publications Page To Home Page
UNCLASSIFIED
End of page.