National Drug Intelligence Center |
The amount of marijuana available for distribution in the United States is unknown; an accurate estimate regarding the amount of marijuana available in the United States is not feasible. In order to determine the amount of processed marijuana available in the United States, precise estimates are required for several critical factors, including the number of plants cultivated domestically and internationally; the amount consumed internationally; the amount produced from a single indoor and outdoor cannabis plant; and the effectiveness of eradication and interdiction/seizure efforts. Production and consumption estimates are available for Mexico, and production estimates are available for Canada--primary foreign source areas for marijuana destined for the United States. However, no reliable estimates of the aforementioned factors are available for the United States.
Despite record-setting eradication efforts in the United States, the availability of marijuana remains relatively high, with limited disruption in supply or price. During 2008, more marijuana was eradicated in the United States than ever before. According to DCE/SP data, an estimated 8 million plants were eradicated from outdoor and indoor cultivation sites throughout the country, a 150 percent increase since 2004 (3,200,121 plants to 8,013,308 plants) (see Table 1 in National Cannabis Cultivation Trends section). These eradication efforts have been successful in removing thousands of pounds of marijuana from the U.S. drug market, but appear to have had limited long-term impact on market supply. No major price fluctuations were reported nationally.15 Nonetheless, the Central Valley HIDTA reports that in 2007 some cultivation site bosses returned to Mexico earlier in the season because their grow sites were eradicated and the sites were no longer profitable that season.
Levels of marijuana use in the United States are higher than those for any other drug, particularly among adults; however, rates of marijuana use are decreasing among adolescents. According to the National Survey on Drug Use and Health (NSDUH) data, the number of individuals 12 and older who used marijuana within the past year has decreased slightly overall from 2004 (25,451,000) through 2007 (25,085,000), the latest year for which data are available. Despite the slight decrease, the number of marijuana users is much higher than for any other drug surveyed, including pharmaceutical drugs (16,280,000) and cocaine (5,738,000). Rates of past year use are highest among adults aged 18 to 25, and use of the drug is stable for that age group (see Table 5). However, rates of past year use for adolescents aged 12 to 17 declined from 15.0 percent in 2003 to 12.5 percent in 2007. Furthermore, Monitoring the Future (MTF) data show that rates of past year use among eighth, tenth, and twelfth graders have decreased overall since 2003. In particular, data show a significant decrease between 2006 and 2007 (the latest date for which such data are available) in rates of past year use among eighth graders and a slight decline among tenth graders. (See Table 6.)
Table 5. Trends in Percentage of Past Year Marijuana Use, 2003-2007
| 2003 | 2004 | 2005 | 2006 | 2007 | |
|---|---|---|---|---|---|
| Individuals 12 and older | 10.6 | 10.6 | 10.4 | 10.3 | 10.1 |
| Adolescents (12-17) | 15.0 | 14.5 | 13.3 | 13.2 | 12.5 |
| Adults (18-25) | 28.5 | 27.8 | 28.0 | 28.0 | 27.5 |
| Adults (26 and older) | 6.9 | 7.0 | 6.9 | 6.8 | 6.8 |
Source: National Survey on Drug Use and Health.
Table 6. Adolescent Trends in Percentage of Past Year Use of Marijuana, 2003-2007
| Grade | 2003 | 2004 | 2005 | 2006 | 2007 |
|---|---|---|---|---|---|
| 8th Grade | 12.8 | 11.8 | 12.2 | 11.7 | 10.3 |
| 10th Grade | 28.2 | 27.5 | 26.6 | 25.2 | 24.6 |
| 12th Grade | 34.9 | 34.3 | 33.6 | 31.5 | 31.7 |
Source: Monitoring the Future.
Some law enforcement agencies identify marijuana as the greatest drug threat in their jurisdictions. Data from NDIC's National Drug Threat Survey (NDTS) for 2008 reveal that 11.3 percent of state and local law enforcement agencies report that marijuana poses the greatest drug threat to their areas; this percentage is higher than for heroin (9.8%) and pharmaceuticals (8.1%) but lower than for powder cocaine (8.7%) and crack (32.2%) and powder methamphetamine (10.3%) and ice methamphetamine (19.1%). NDTS 2008 data further reveal that 8.0 percent of state and local law enforcement agencies report that marijuana is the drug that most contributes to property crimes in their areas; 4.1 percent report that marijuana most contributes to violent crimes.
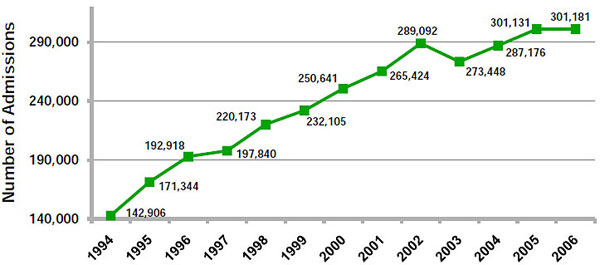
Marijuana use often results in adverse health consequences to abusers, placing a burden on medical services. According to NSDUH 2007 data, an estimated 25 million people aged 12 and older were dependent on or abusers of marijuana during the past year. This percentage is higher than for any other illicit drug. An increasing number of abusers are suffering adverse health consequences from their marijuana use, such as adverse physical, emotional, or behavioral changes or acute psychosis, including hallucinations or delusions, which necessitate medical intervention. As such, marijuana-related treatment admissions are increasing. Long-term trends of marijuana treatment admissions indicate a growing need for treatment services; according to Treatment Episode Data Set (TEDS), the number of marijuana-related treatment admissions doubled between 1994 and 2006, the most recent year for which data are available. (See Figure 14.)
Figure 14. Marijuana-Related Admissions to Publicly Funded Treatment Facilities, 1994-2006
Source: Treatment Episode Data Set.
15. Marijuana prices are an indicator of increasing and decreasing availability.
End of page.