To Contents
To Previous Page
To Appendix B
To Publications
Page
To Home Page
To Contents
To Previous Page
To Appendix B
To Publications
Page
To Home Page


U.S. Department of Justice |
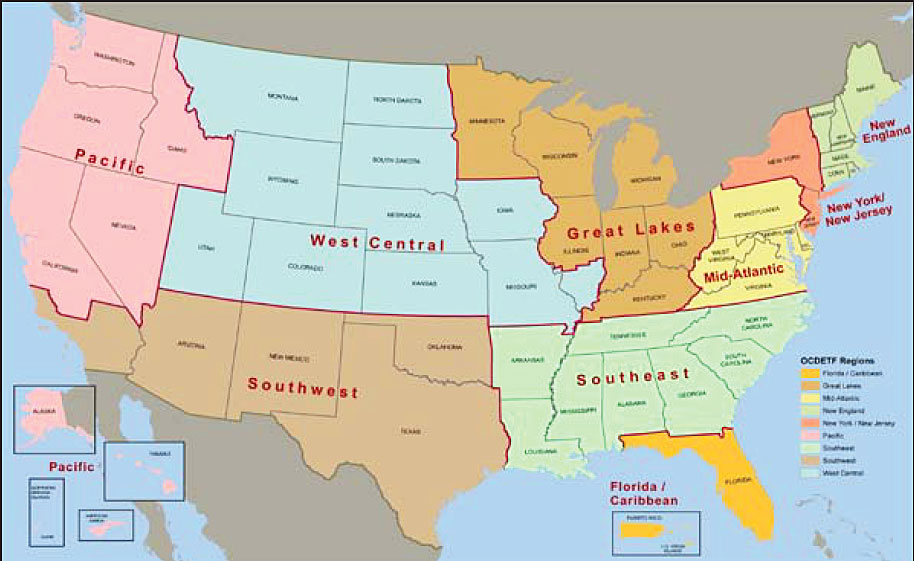
Map A1. Nine OCDETF Regions
Map A2. Drug Distribution by Select DTOs, by HIDTA Region
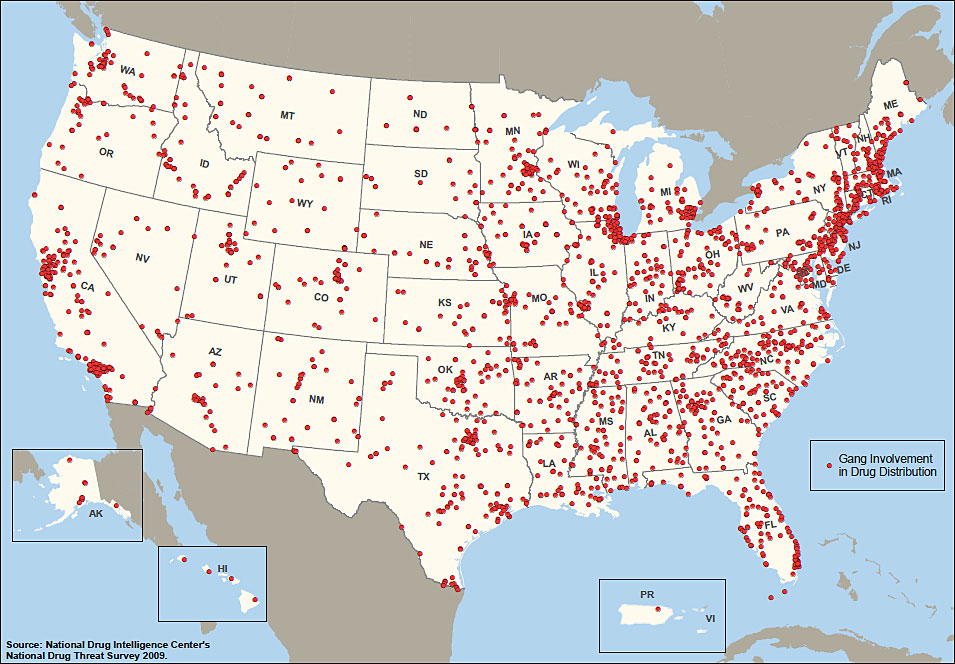
Map A3. 2009 Street Gang Involvement in Drug Distribution
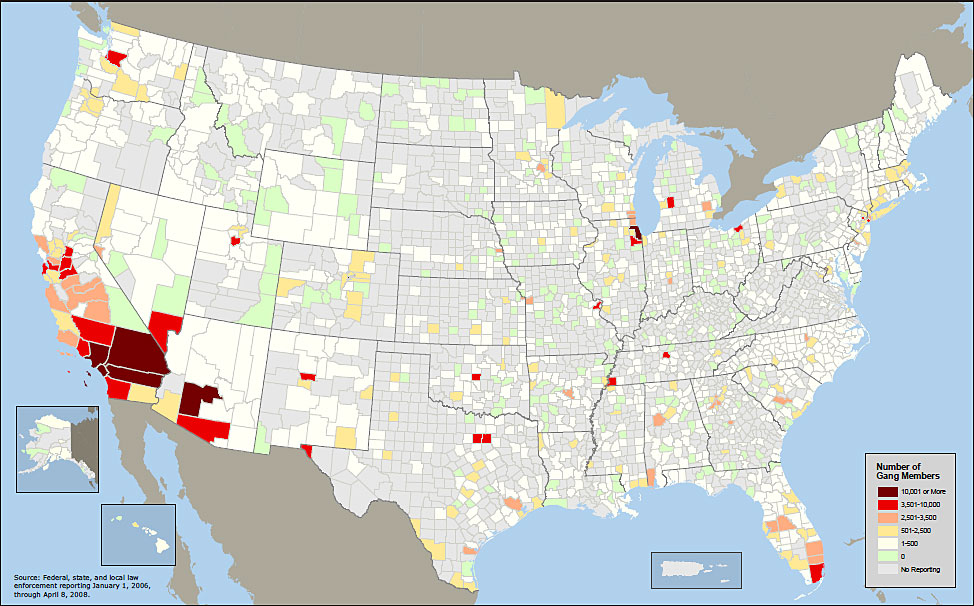
Map A4. Gang Membership by County
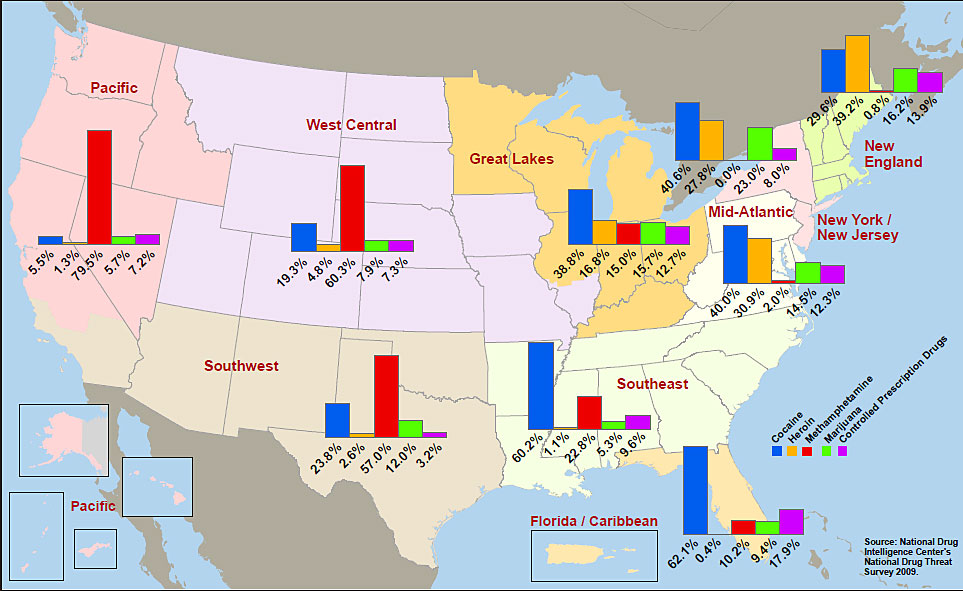
Map A5. 2009 Greatest Drug Threat, by Region, as Reported by State and Local Agencies
Map A6. 2009 Greatest Drug Threat, as Reported by State and Local Agencies
Source: 2009 High Intensity Drug Trafficking Area reports.
*Map depicts presence only, not level of activity.
Source: National Drug Intelligence Center's National Drug Threat Survey 2009.
Source: Federal, state, and local law enforcement reporting January 1, 2006, through April 8, 2008.
Source: National Drug Intelligence Center's National Drug Threat Survey 2009.
Source: National Drug Intelligence Center's National Drug Threat Survey 2009.
Unclassified
End of page.