2017 Hate Crime Statistics
FBI Releases 2017 Hate Crime Statistics
The FBI's Uniform Crime Reporting (UCR) Program serves as the national repository for crime data collected by law enforcement. Its primary objective is to generate reliable information for use in law enforcement administration, operation, and management. Reported yearly, the 2017 data, submitted by 16,149 law enforcement agencies (up 5.9% from 15,254 agencies in 2016), provide information about the offenses, victims, offenders, and locations of hate crimes. Of these agencies, 2,040 reported 7,175 hate crime incidents involving 8,437 offenses.
The table and graphs below provide a high-level overview of some of the data. The full report can be viewed here: https://ucr.fbi.gov/hate-crime/2017.
| Victims of Hate Crime Incidents | Offenses by Crime Category |
|---|---|
|
Among the 8,437 hate crime offenses reported:
|
| Known Offenders | Location Type |
|
Of the 6,370 known offenders:
Other races accounted for the remaining known offenders. Of the 5,131 known offenders for whom ethnicity was reported:
Of the 4,895 known offenders for whom ages were known:
|
Law enforcement agencies may specify the location of an offense within a hate crime incident as 1 of 46 location designations.
|
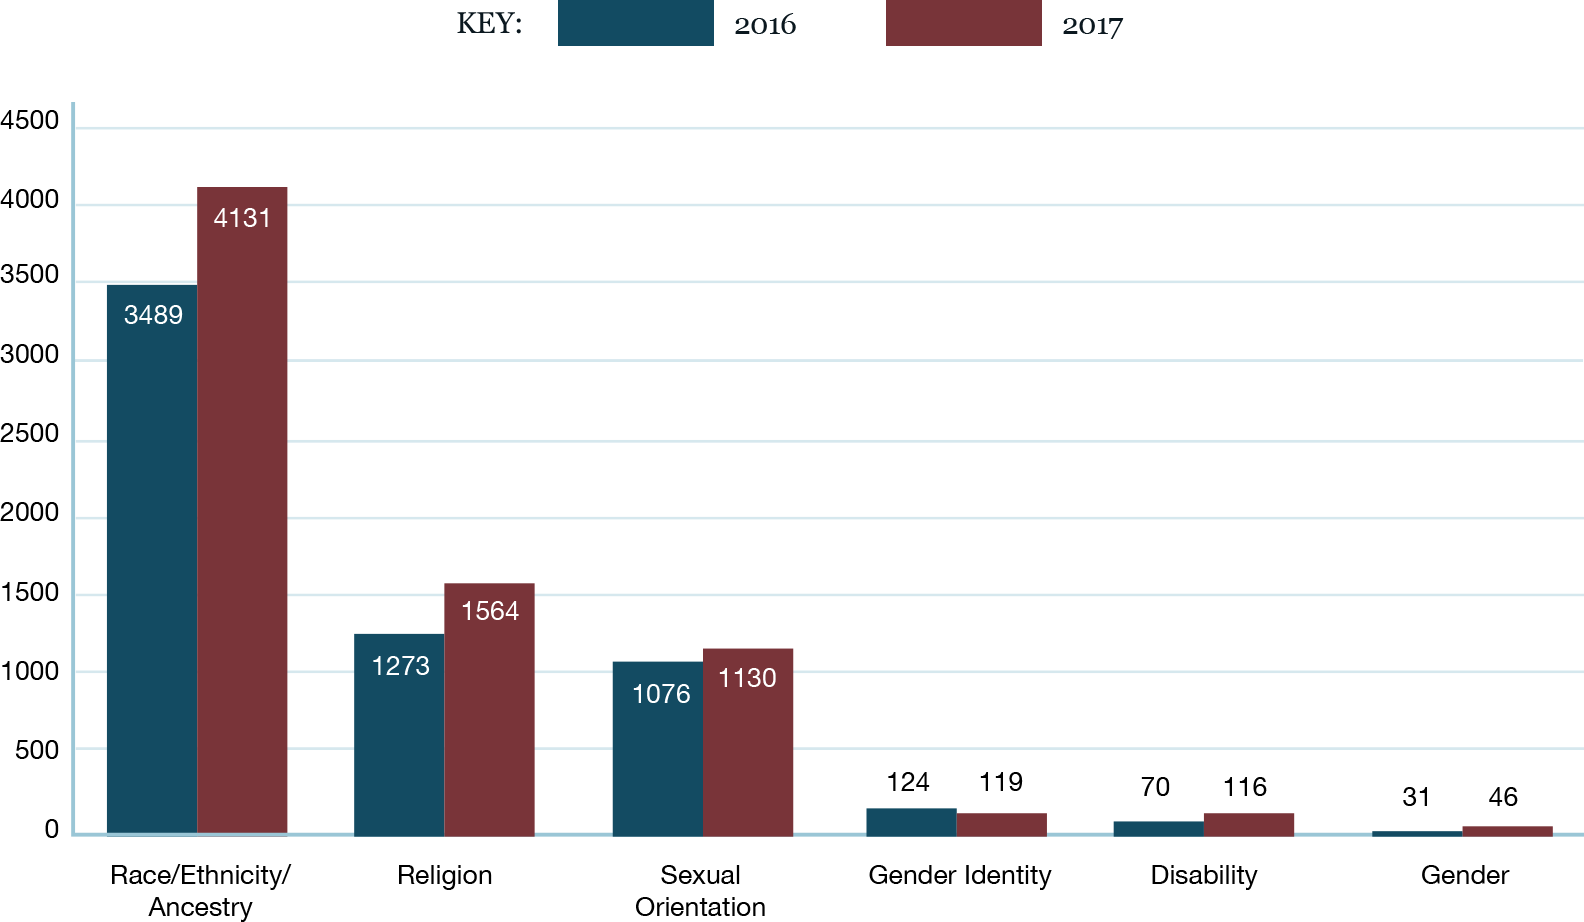
2016 and 2017 data for bias motivation categories for single bias incidents
Bias Motivation Categories for Single-bias Incidents in 2017
Description of images on this page:
Single Bias Incident Bias Motivations by Category: This is a bar chart comparing the 2016 and 2017 data for bias motivation categories for single bias incidents. They are as follows:
| Bias Motivation Categories | 2016 | 2017 |
|---|---|---|
| Race/Ethnicity/Ancestry | 3489 | 4131 |
| Religion | 1273 | 1564 |
| Sexual Orientation | 1076 | 1130 |
| Gender Identity | 124 | 119 |
| Disability | 70 | 116 |
| Gender | 31 | 46 |
Bias Motivation Categories for Single-bias Incidents in 2017: This is a pie chart showing the percentages of bias motivation categories for single-bias incidents in 2017. They are as follows:
| Race/Ethnicity/Ancestry | 58.1% |
| Religion | 22.0% |
| Sexual Orientation | 15.9% |
| Gender Identity | 11.7% |
| Disability | 1.6% |
| Gender | 0.6% |


