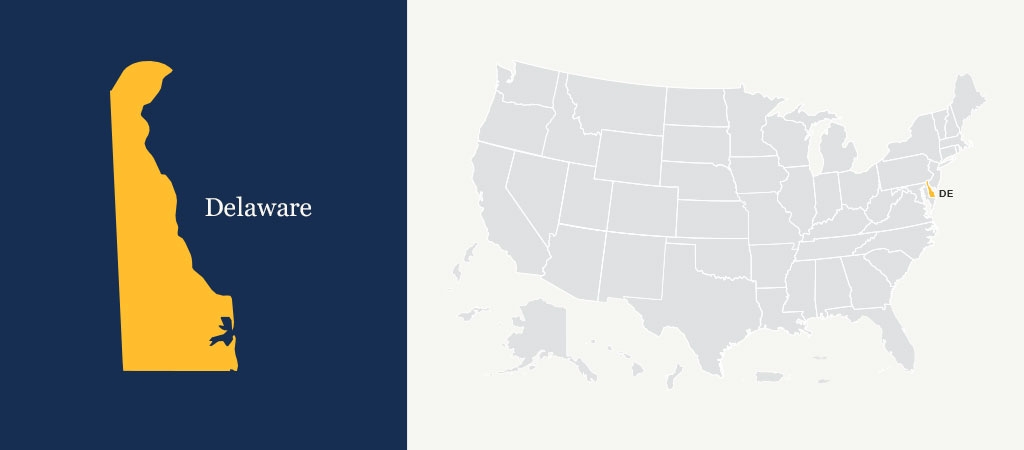
Delaware
Bias Motivation Categories by Year
| Bias Motivation Category | 2021 | 2022 | 2023 |
|---|---|---|---|
| Race/Ethnicity/Ancestry | 5 | 10 | 10 |
| Religion | 2 | 4 | 10 |
| Sexual Orientation | 2 | 2 | 0 |
| Disability | 0 | 0 | 0 |
| Gender | 0 | 0 | 0 |
| Gender Identity | 0 | 0 | 0 |
| Total: | 9 | 16 | 20 |
Types of Crime
| Crimes Against Persons | 11 | 47.8% |
| Crimes Against Property | 12 | 52.2% |
| Crimes Against Society | 0 | 0.0% |
Bias Motivation Categories
| Race/Ethnicity/Ancestry | 10 | 50.0% |
| Religion | 10 | 50.0% |
| Sexual Orientation | 0 | 0.0% |
| Disability | 0 | 0.0% |
| Gender | 0 | 0.0% |
| Gender Identity | 0 | 0.0% |
*2021 was the first year that the annual hate crimes statistics were reported entirely through the National Incident-Based Reporting System (NIBRS). As a result of the shift to NIBRS-only data collection, law enforcement agency participation in submitting all crime statistics, including hate crimes, fell significantly from 2020 to 2021.
News
January 11, 2024
DOJ Offices

| Baltimore 2600 Lord Baltimore Drive Baltimore, MD 21244 T: 410.265.8080 baltimore.fbi.gov |

| Delaware (Wilmington) www.justice.gov/usao-de/contact-us |

| Mid-Atlantic Regional Office 200 2nd & Chestnut Street Suite 208 Philadelphia, PA 19106 T: 215.597.2344 F: 215.597.9148 askcrs@usdoj.gov |


