| BEFORE THE
DEPARTMENT OF TRANSPORTATION
WASHINGTON, D.C. U.S.-U.K. Alliance Case Docket OST-2001-11029 Public Comments of the Department of Justice: Exhibits |
Exhibit 1 Exhibit DOJ-1: Nonstop Daily (One-way) Departures in AA/BA Overlap Markets
| Boston-London | | Carrier | | | Daily Departures in 2000 | Current (post Sept.) Daily Departures | Entry and Exit between 1998 & Summer 2001 | |
|---|
AA | | LHR | 2 | 2 | | | BA | | LHR | 3 | 2 | | | UA | | LHR | 1 | 1 | Entered 1999 | | VS | | LHR | 0 | Entry | | | | | | | | | | | AA | | LGW | 0 | 0 | Exited 1999 | | DL | | LGW | 0 | 1 | Entered 2001 | | VS | | LGW | 1 | Exit | | | | | | | | | | | | | | | | | | | New York-London | | | | | | Carrier | | | Daily Departures in 2000 | Current (post Sept.) Daily Departures | Entry and Exit between 1998 & Summer 2001 | |
|---|
AA | JFK | LHR | 6 | 4 | | | AI | JFK | LHR | 1 | 1 | | | BA | JFK | LHR | 7 | 5 | | | KU | JFK | LHR | 0.4 | 0.4 | | | UA | JFK | LHR | 3 | 2 | | | VS | JFK | LHR | 3 | 2 | | | | | | | | | | | BA | JFK | LGW | 1 | Exit | | | | | | | | | | | AA | EWR | LHR | 1 | 1 | | | BA | EWR | LHR | 2 | 2 | | | UA | EWR | LHR | 1 | 1 | | | VS | EWR | LHR | 1 | 2 | | | | | | | | | | | CO | EWR | LGW | 2 | 2 | | | VS | EWR | LGW | 1 | Exit | | | | | | | | | | | | | | | | | | | Miami-London | | | | | | Carrier | | | Daily Departures in 2000 | Current (post Sept.) Daily Departures | Entry and Exit between 1998 & Summer 2001 | |
|---|
AA | | LHR | 1 | 1 | | | BA | | LHR | 1 | 2 | | | VS | | LHR | 0 | 0 | Exited 1999** | | | | | | | | | | AA | | LGW | 0 | 0 | Exited 1999 | | BA | | LGW | 1 | 0 | Exited 2001* | | VS | | LGW | 1 | 1 | Entered 1999** | | | | | | | | | | * BA switched its LGW service to an additional LHR frequency in 2001 before September 11. | | ** VS switched its service from LHR to LGW in 1999. | | | | | | | | | | | | | | | | | | | | | | Chicago-London | | | | | | Carrier | | | Daily Departures in 2000 | Current (post Sept.) Daily Departures | Entry and Exit between 1998 & Summer 2001 | |
|---|
AA | | LHR | 4 | 3 | | | AI | | LHR | 0.4 | 0.3 | | | BA | | LHR | 2 | 2 | | | UA | | LHR | 3 | 3 | | | VS | | LHR | 1 | Exit | Entered 1999* | | | | | | | | | | *VS entered in 1999. Exited after September 11, 2001 | | | | | | | | | | | | | | | | | | | Dallas-London | | | | | | Carrier | | | Daily Departures in 2000 | Current (post Sept.) Daily Departures | Entry and Exit between 1998 & Summer 2001 | |
|---|
AA | | LGW | 2 | 1 | | | BA | | LGW | 1 | 1 | | | | | | | | | | | | | | | | | | | Los Angeles-London | | | | | Carrier | | | Daily Departures in 2000 | Current (post Sept.) Daily Departures | Entry and Exit between 1998 & Summer 2001 | |
|---|
AA | | LHR | 1 | 1 | | | BA | | LHR | 2.5 | 2 | | | NZ | | LHR | 1 | 1 | | | UA | | LHR | 1.6 | 1 | | | VS | | LHR | 2 | 2 | | | | | | | | | | | | | | | | | | | Notes | | | | | | | 2000 Frequencies from annual t-100 data. | | | | Current frequency data from the 12/12 OAG & carrier websites. Reflects post Sept. 11 changes. | |
Exhibit 2A NY-LON 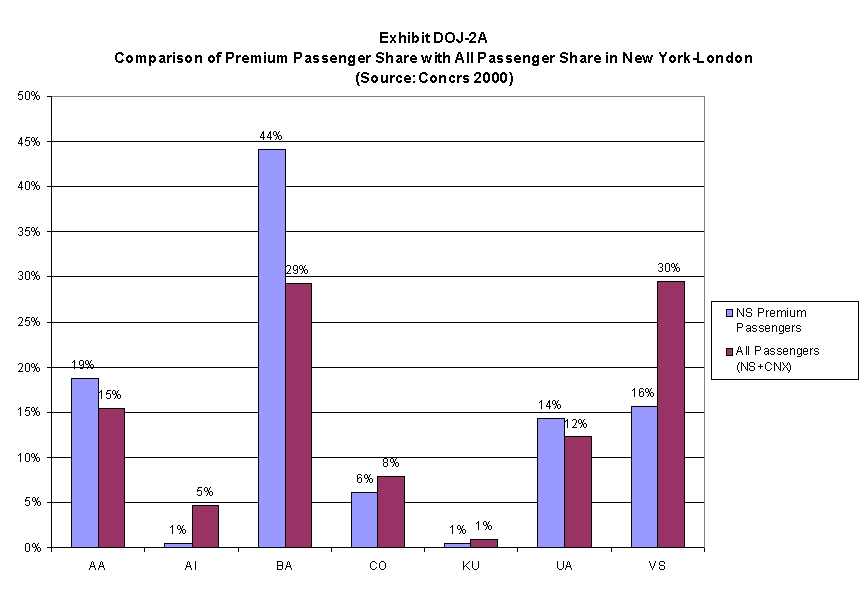 [D] [D]
Exhibit 2B BOS-LON 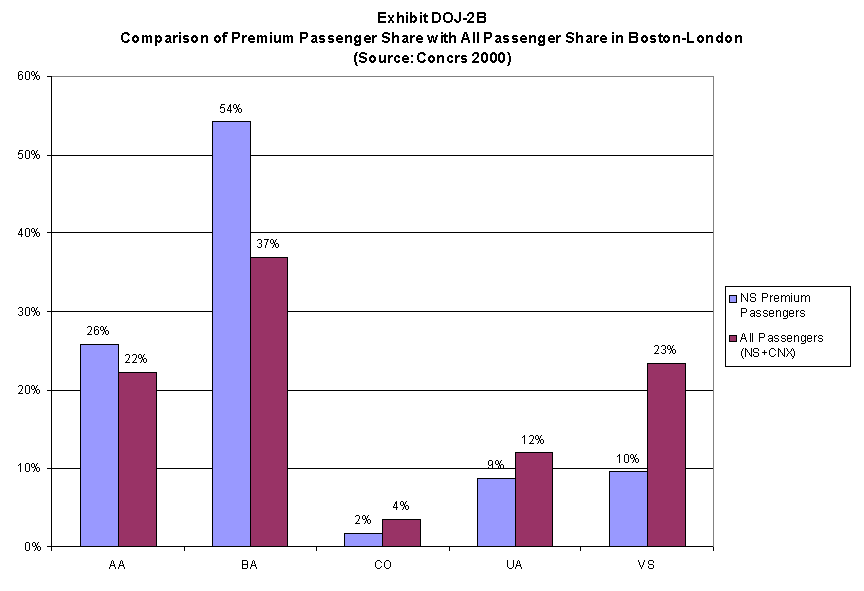 [D] [D]
Exhibit 2C MIA-LON 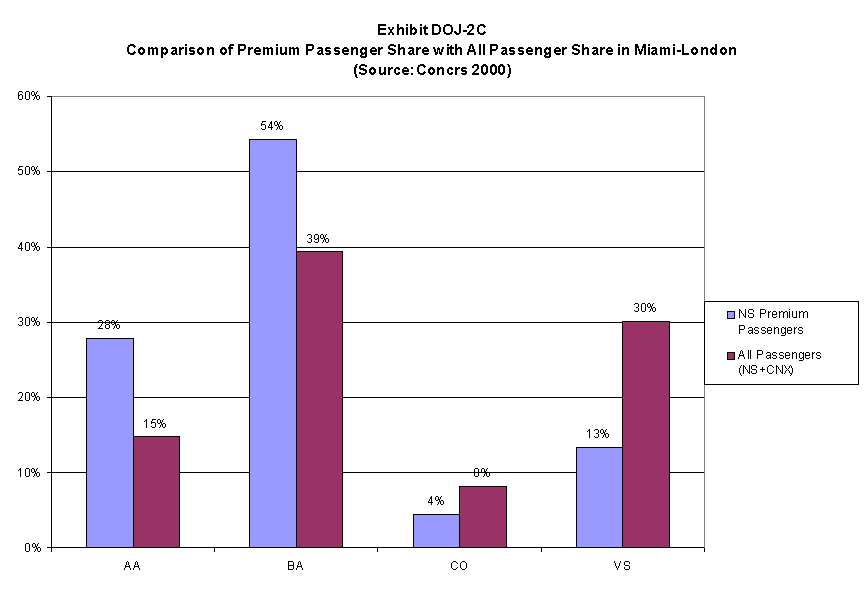 [D] [D]
Exhibit 2D ORD-LON 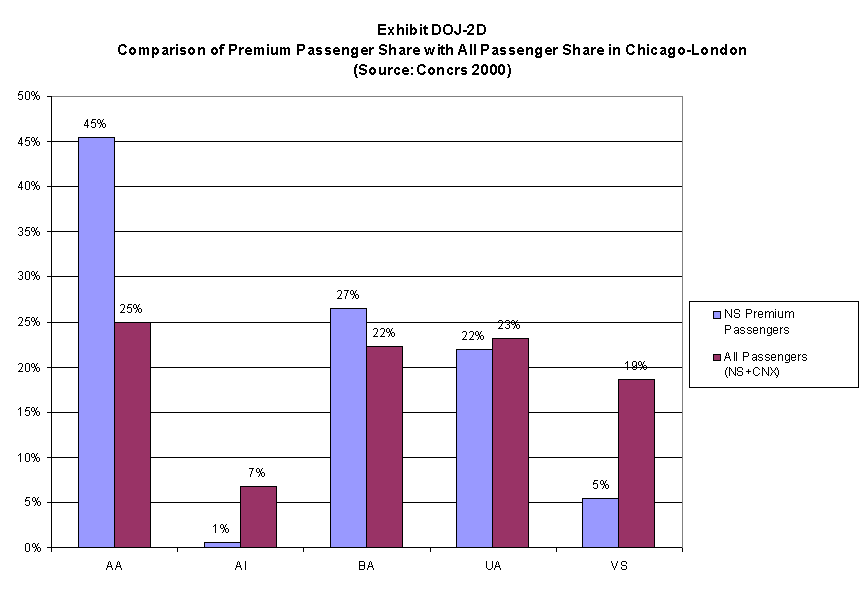 [D] [D]
Exhibit 2E DFW-LON 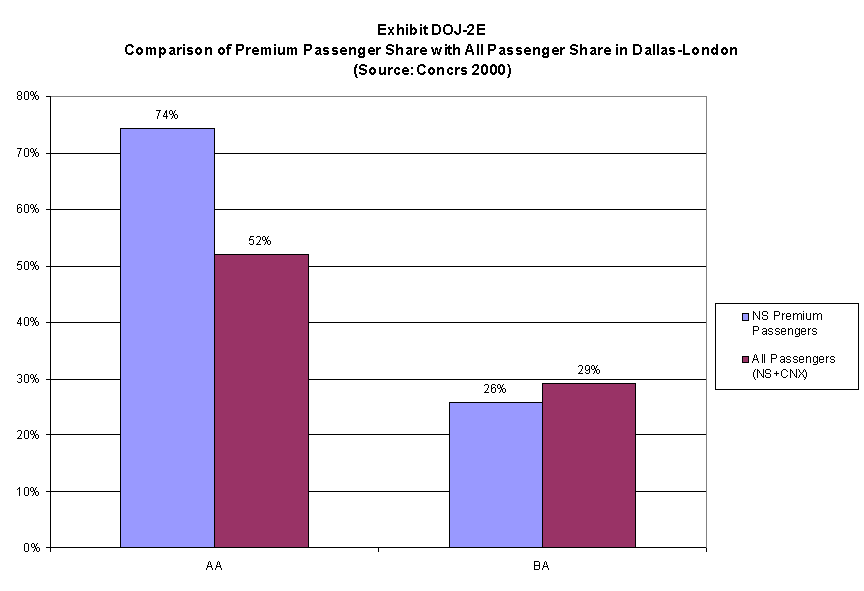 [D] [D]
Exhibit 2F LAX-LON 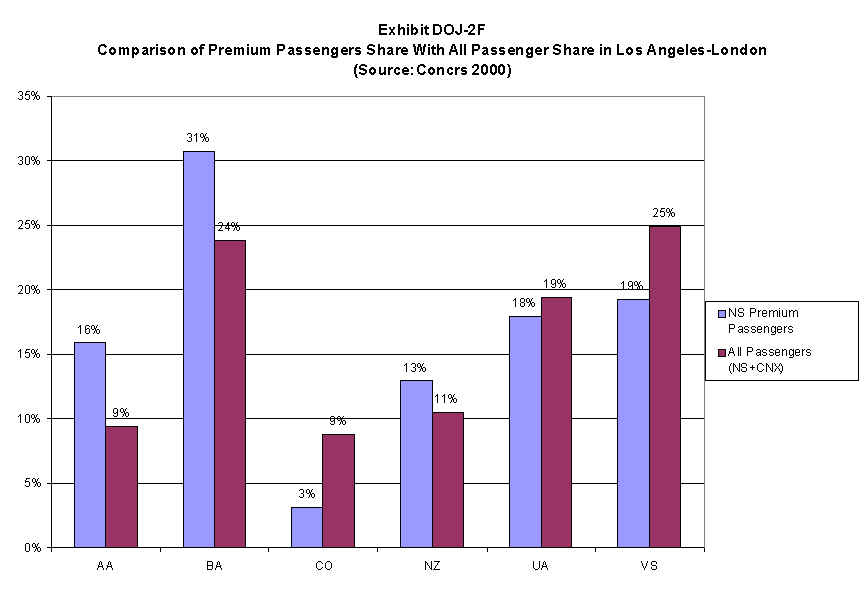 [D] [D]
Exhibit 3 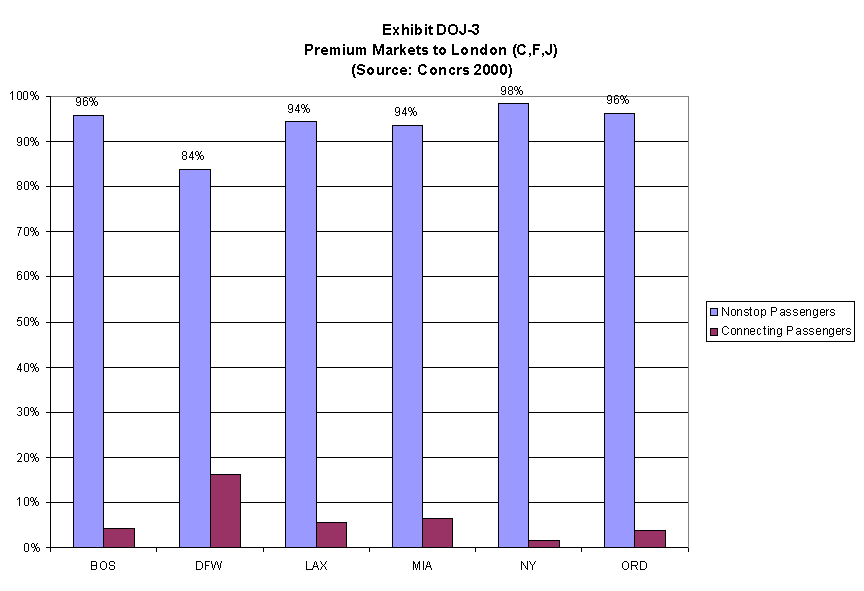 [D] [D]
Exhibit 4 | | | | | | | | Exhibit DOJ-4 | Premium Markets to/from London (C,F,J class passengers) | | | | | | | | | | | | | | | | | | | Passenger Counts by Market and Type | | | | | | | | | | | | | | | | | | | | Connecting Categories
| |
|---|
Market | Total Passengers | Nonstop Passengers | Connecting Passengers | LHR- AA UA Online | LGW- US Domestic Online Carriers | European Connects | Other |
|---|
BOS | 70,861 | 67,868 | 2,993 | 344 | 141 | 630 | 1,878 | DFW | 30,489 | 25,556 | 4,933 | 3,256 | 493 | 103 | 1,081 | LAX | 67,183 | 63,303 | 3,880 | 1,827 | 455 | 671 | 927 | MIA | 35,097 | 32,834 | 2,263 | 1,065 | 194 | 278 | 726 | NY | 487,922 | 479,902 | 8,020 | 282 | 143 | 4156 | 3,439 | ORD | 78,229 | 75,342 | 2,887 | 606 | 327 | 604 | 1,350 | | | | | | | | | | | | | | | | | | | Passenger Shares by Market and Type | | | | | | | | | | | | | | | | | | | | Connecting Categories
| |
|---|
Market | Total Passengers | Nonstop Passengers | Connecting Passengers | LHR- AA UA Online | LGW- US Domestic Online Carriers | European Connects | Other |
|---|
BOS | 70,861 | 96% | 4% | 0.49% | 0.20% | 0.89% | 2.65% | DFW | 30,489 | 84% | 16% | 10.68% | 1.62% | 0.34% | 3.55% | LAX | 67,183 | 94% | 6% | 2.72% | 0.68% | 1.00% | 1.38% | MIA | 35,097 | 94% | 6% | 3.03% | 0.55% | 0.79% | 2.07% | NY | 487,922 | 98% | 2% | 0.06% | 0.03% | 0.85% | 0.70% | ORD | 78,229 | 96% | 4% | 0.77% | 0.42% | 0.77% | 1.73% | | | | | | | | | | | | | | | | | | | | | | | | | | | | Source: Concrs 2000 | | | | | |
Exhibit 5 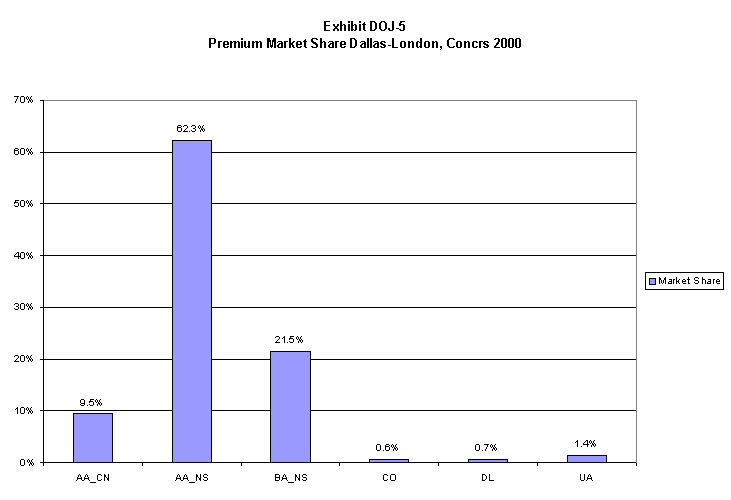 [D] [D]
Exhibit 6
Confidential
Exhibit 7 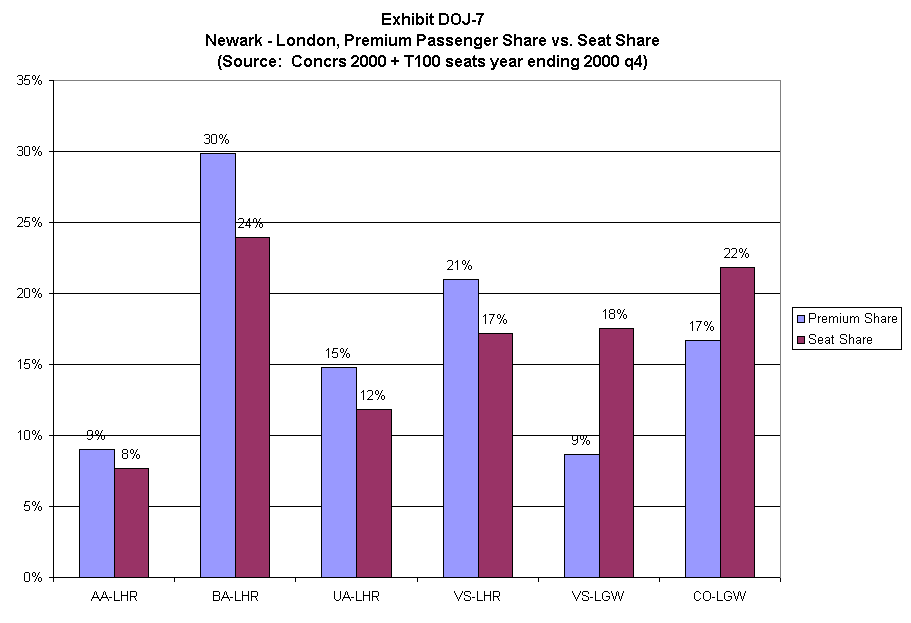 [D] [D]
Exhibit 8 | | | | | | | Exhibit DOJ-8 | | Nonstop Premium Passengers Share by Point of Origin | | | | | | | | | | | | | | | | | | Origin | Destination | Marketing Airline | F, J, & C Passengers | Total Market Passengers | Marketing Airline Share | |
|---|
BOS | LON | AA | 11,458 | 28,792 | 39.80% | | BOS | LON | BA | 12,745 | 28,792 | 44.27% | | BOS | LON | CO | 294 | 28,792 | 1.02% | | BOS | LON | UA | 2,979 | 28,792 | 10.35% | | BOS | LON | VS | 1,305 | 28,792 | 4.53% | | | | | | | | | | LON | BOS | AA | 4,341 | 30,430 | 14.27% | | LON | BOS | BA | 19,355 | 30,430 | 63.60% | | LON | BOS | CO | 653 | 30,430 | 2.15% | | LON | BOS | UA | 1,929 | 30,430 | 6.34% | | LON | BOS | VS | 4,150 | 30,430 | 13.64% | | | | | | | | | | | | | | | | | | Origin | Destination | Marketing Airline | F, J, & C Passengers | Total Market Passengers | Marketing Airline Share | |
|---|
NY | LON | AA | 57,596 | 205,187 | 28.07% | | NY | LON | BA | 74,362 | 205,187 | 36.24% | | NY | LON | CO | 17,027 | 205,187 | 8.30% | | NY | LON | UA | 31,011 | 205,187 | 15.11% | | NY | LON | VS | 23,356 | 205,187 | 11.38% | | | | | | | | | | LON | NY | AA | 21,974 | 217,513 | 10.10% | | LON | NY | BA | 114,418 | 217,513 | 52.60% | | LON | NY | CO | 7,969 | 217,513 | 3.66% | | LON | NY | KU | 2,221 | 217,513 | 1.02% | | LON | NY | UA | 28,824 | 217,513 | 13.25% | | LON | NY | VS | 41,417 | 217,513 | 19.04% | | | | | | | | | | | | | | | | | | Origin | Destination | Marketing Airline | F, J, & C Passengers | Total Market Passengers | Marketing Airline Share | |
|---|
MIA | LON | AA | 4,697 | 9,899 | 47.45% | | MIA | LON | BA | 3,941 | 9,899 | 39.81% | | MIA | LON | CO | 348 | 9,899 | 3.52% | | MIA | LON | VS | 912 | 9,899 | 9.21% | | | | | | | | | | LON | MIA | AA | 2,378 | 15,800 | 15.05% | | LON | MIA | BA | 9,733 | 15,800 | 61.60% | | LON | MIA | CO | 920 | 15,800 | 5.82% | | LON | MIA | VS | 2,766 | 15,800 | 17.51% | | | | | | | | | | Origin | Destination | Marketing Airline | F, J, & C Passengers | Total Market Passengers | Marketing Airline Share | |
|---|
ORD | LON | AA | 22,850 | 38,721 | 59.01% | | ORD | LON | BA | 3,974 | 38,721 | 10.26% | | ORD | LON | UA | 10,729 | 38,721 | 27.71% | | ORD | LON | VS | 873 | 38,721 | 2.25% | | | | | | | | | | LON | ORD | AA | 8,517 | 29,133 | 29.23% | | LON | ORD | BA | 13,883 | 29,133 | 47.65% | | LON | ORD | UA | 3,669 | 29,133 | 12.59% | | LON | ORD | VS | 2,921 | 29,133 | 10.03% | | | | | | | | | | | | | | | | | | Origin | Destination | Marketing Airline | F, J, & C Passengers | Total Market Passengers | Marketing Airline Share | |
|---|
DFW | LON | AA | 13,402 | 15,077 | 88.89% | | DFW | LON | BA | 1,675 | 15,077 | 11.11% | | | | | | | | | | LON | DFW | AA | 4,100 | 7,903 | 51.88% | | LON | DFW | BA | 3,800 | 7,903 | 48.08% | | | | | | | | | | | | | | | | | | Origin | Destination | Marketing Airline | F, J, & C Passengers | Total Market Passengers | Marketing Airline Share | |
|---|
LAX | LON | AA | 7,155 | 30,991 | 23.09% | | LAX | LON | BA | 6,935 | 30,991 | 22.38% | | LAX | LON | CO | 956 | 30,991 | 3.08% | | LAX | LON | NZ | 3,430 | 30,991 | 11.07% | | LAX | LON | UA | 7,369 | 30,991 | 23.78% | | LAX | LON | VS | 5,106 | 30,991 | 16.48% | | | | | | | | | | LON | LAX | AA | 1,777 | 24,800 | 7.17% | | LON | LAX | BA | 9,590 | 24,800 | 38.67% | | LON | LAX | CO | 870 | 24,800 | 3.51% | | LON | LAX | NZ | 3,570 | 24,800 | 14.40% | | LON | LAX | UA | 2,733 | 24,800 | 11.02% | | LON | LAX | VS | 6,254 | 24,800 | 25.22% | | | | | | | | | | | | | | | | | | Source: 2000 Concrs Data, Classes F, J, & C Nonstop Passengers | | | | | | | | | |
|

 U.S. Department
of Justice


